algn - Reports
The Pattern Beneath the Symptoms
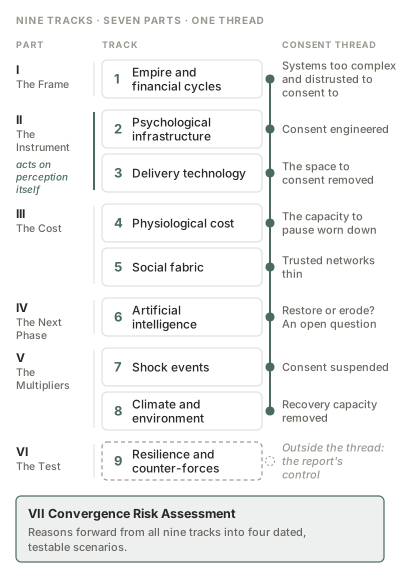
Nine converging systemic pressures on human life, and what they are doing to the capacity to see them.
Abstract
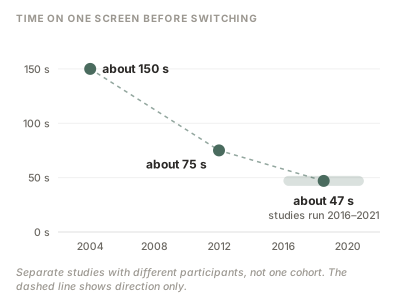
Trust in the United States federal government fell from 77 per cent in 1964 to 17 per cent in September 2025. The share of Americans reporting no close friends rose from 3 per cent in 1990 to 17 per cent in 2024. The average time office workers spent on one screen before switching fell from about two and a half minutes in 2004 to roughly forty-seven seconds in studies run between 2016 and 2021.
These measures come from unrelated fields. No one collecting any of them was studying the others. They move in the same direction anyway.
This report assembles nine bodies of evidence that share that window: empire and financial cycles, the psychology of persuasion, the technologies built to deliver it, the physiological cost of continuous activation, the contraction of close relationships, artificial intelligence, acute shock events, environmental stress, and the historical record of recovery. Each is documented from primary sources and rated for strength. Where the evidence is contested, both positions are stated and neither is privileged.
The report does not identify a single cause. The complexity of the causation is the finding, and the human tendency to locate one culprit inside a complex system is itself among the things documented here.
What it does identify is a problem with the response. The capacities a population would need in order to recognise its situation and act on it (sustained attention, trusted relationships, working institutions and time to deliberate) are among the measures in decline. One of the nine tracks exists to test that claim against the historical record of decline arrested and reversed. It finds that the mechanisms which have worked in the past draw on the same resources.
None of which makes the outcome fixed. The strongest single experiment in the report found that changing the ranking of a social media feed moved political hostility measurably in both directions inside ten days. A three-month experiment on Facebook and Instagram in 2020 found no change from switching to a chronological feed. What these systems do is a design decision rather than a property of the technology.
One domain here cannot be assessed to the standard applied to the other eight. The ranking and recommendation systems that now mediate a large share of human attention are studied almost entirely from outside. The strongest causal evidence in this report about their effects comes from a single preregistered ten-day experiment on one platform. Most of what is known about how these systems were built and tuned comes from documents a former employee removed in 2021. In December 2025 the European Commission issued its first non-compliance fine under the Digital Services Act, and among the grounds was restricted researcher access.
Whether that environment also changes the speed at which the other dynamics in this report unfold has never been formally studied. It is the most consequential unanswered question here, and it cannot be answered from outside. Systems running continuously on the attention of billions of people should be measurable by people who do not work for the companies operating them. As it stands, the institutions with the deepest access to the relevant data have the least incentive to publish what it shows.
The closing section reasons forward into four scenarios and states, by date and by measure, what would show each of them to be wrong.
Figure 1 · The convergence
Nine tracks, one timeline. The windows where several were in stress at once, and how full they have become.
Tracks in stress per window: AD 235–284, Rome, 3 of 9; 1914–1923, Europe, 3 of 9; 1929–1933, 4 of 9; 1939–1945, 8 of 9; 1964–1974, 4 of 9; 1971, 1 of 9; 2001–2003, 3 of 9; 2008–2012, 5 of 9; 2020–2022, 9 of 9; 2024–2026, 9 of 9. The two most recent windows have all nine tracks in stress.
- Track in stress. Length is the window’s duration, not severity
- Same, outside the selected window
- Convergence window; darker when selected
- Counter-forces under pressure
- Track 2: a standing capability, not a trend
- Dated event (on track focus)
- Link between tracks (Connected view; synthesis)
Most headline measures in Tracks 1, 5 and 7 at or near their worst recorded levels; Track 4 mixed, with mortality and adolescent measures improving since 2023; Tracks 6 and 8 accelerate.
Select a track to see its one-line thesis, its direction and rate from the Part VII inputs, and the dated events behind it.
- Track in stress in that window
- Counter-forces under pressure
- Not in stress
- 9Tracks in stress, of nine
Most headline measures in Tracks 1, 5 and 7 at or near their worst recorded levels; Track 4 mixed, with mortality and adolescent measures improving since 2023; Tracks 6 and 8 accelerate.
View as table
| Period | Tracks in stress | Cross-track connections |
|---|---|---|
| AD 235–284, Rome | 1, 5, 8 | Currency debasement, institutional failure, climate variability, and plague in combination; social fragmentation and scapegoating followed |
| 1914–1923, Europe | 1, 5, 7 | Imperial transition, mass casualties, hyperinflation in Germany, collapse of trust in official accounts |
| 1929–1933 | 1, 4, 5, 7 | Debt peak, wealth concentration at 1920s highs, mass unemployment, suicide peak, marriage and birth rates falling |
| 1939–1945 | 1, 2, 3, 4, 5, 7, 8, 9 | Total mobilisation, suspension of civil liberties, followed by the strongest institutional rebuild on record |
| 1964–1974 | 1, 2, 3, 5 | Television-era political communication matures as trust begins its long fall from its 1964 peak |
| 1971 | 1 | End of dollar convertibility; the financial-cycle inflection Dalio’s framework anchors to |
| 2001–2003 | 1, 3, 7 | Shock window produces durable surveillance infrastructure; brief trust spike then decline |
| 2008–2012 | 1, 3, 4, 5, 7 | Financial crisis, trust falling below 30 per cent and staying there, ranked feeds spreading, smartphone ownership reaching nearly half of US adults, adolescent mental health beginning to deteriorate |
| 2020–2022 | All nine | Pandemic compresses digital dependency, prunes social networks, produces a brief trust rally smaller than 2001’s, and coincides with the first large-scale deployment of generative AI |
| 2024–2026 | All nine | Most headline measures in Tracks 1, 5 and 7 at or near their worst recorded levels; Track 4 mixed, with mortality and adolescent measures improving since 2023; Tracks 6 and 8 accelerate |
Contents
Preamble: What This Is, What It Isn’t, and What We’re Asking
What this is
This is a documented attempt to map a pattern.
Nine bodies of evidence have been assembled, evidence-rated, and placed on a shared timeline. They cover empire and financial cycles, the history of psychological persuasion, the successive technologies that delivered it, the physiological consequences at population scale, the contraction of social bonds, the arrival of artificial intelligence, the dynamics of acute shock events, the role of environmental and climate stress, and the forces that have historically resisted or reversed decline.
The project began with a simple question: are these things connected, or are they coincidental?
The answer the report produces is a framework for exploration, not a conclusion. The nine tracks document real phenomena using primary sources, peer-reviewed work, and longitudinal data. The claim that they form a single pattern, that they express the same underlying dynamic across different domains at once, is the report’s analytical contribution. It is flagged throughout as synthesis, not finding.
Within that general complexity, the report identifies one thread as occupying a distinct position: the trajectory from Freud’s mapping of the unconscious, through its commercial application, to the algorithmic infrastructure of the present. This thread is not presented as the cause of the pattern. It is identified as the mechanism that operates on the human capacity to perceive and respond to the pattern, and as the domain where the consequences of inadequate independent study are most acute. The evidence for that distinction builds across the tracks. The reader meets it progressively, not as a premise.
One track is built to test the rest. Track 9 examines resilience and counter-forces: the institutions, communities, and turning points that have historically arrested or reversed the kinds of decline the other tracks document. It carries equal weight in the final assessment.
What this isn’t
This is not a causal proof. Documenting that institutional trust, friendship networks, and the time people at work stay on a single screen before switching all declined over the same period does not establish that they declined for the same reason, or that any one factor caused the others. The report proposes a causal framework. It does not prove one.
This is not a complete account. The data is predominantly American. The nine tracks were selected because together they produced the most coherent pattern, not because they are the only domains that matter. Other domains, geographies, or frameworks may produce a different pattern. That would be a valuable finding.
This is not politically motivated. The report advocates no party, movement, or policy programme. Where evidence points in directions conventionally associated with a political viewpoint, it is included without editorial adjustment. Where evidence contradicts the thesis, it is included and given weight: see the contested evidence in Track 3 and the whole of Track 9.
This is not a product pitch. No organisation, technology, product, or design approach is advocated. Track 6 describes a fork, two genuinely different directions for how AI can develop within the pattern documented here, and deliberately leaves it unresolved.
This is not finished. The phenomena documented here are ongoing. Some findings rated Moderately strong today will strengthen or weaken with replication. Some synthesis claims will find support or be falsified. The report is a timestamped snapshot, and its predictive section is written so that it can be proven wrong.
What we’re asking
If you work in any field the report touches: tell us where we are wrong. A figure, a date, a characterisation of a study. Contradicting data is as valuable as confirming data.
If you are affected by what the report describes: your experience is data. If the framework holds in your life, that is worth knowing. If it does not, if your trust is high, your social fabric intact, your attention unimpaired, that is equally worth knowing and probably more interesting.
If you think the framework is wrong: the strongest contribution is a coherent alternative explanation for why these domains are moving in the same direction at the same time. Disagreement that engages with the evidence is more useful than agreement that does not.
The report does not need to be right. It needs to be as accurate as the evidence allows.
How to Read This Report
Evidence ratings
Every substantive claim carries a rating. Ratings appear inline where a claim needs one and in a table at the close of each track.
- Strong Peer-reviewed, replicated, or drawn from primary data with consistent methodology over time. Stated directly.
- Moderately strong Directionally consistent evidence that needs further replication. Stated with qualified language.
- Genuinely contested Credible scholars disagree. Both positions are named and neither is privileged.
- Confirmed gap The question exists; the evidence does not yet.
- Synthesis The report’s own analytical contribution. Not a single-source finding, and flagged so it can be tested.
Geographic scope
The United States is the primary case study for social, institutional, and cultural data. Two reasons justify this: the depth and continuity of American longitudinal datasets, and the position of the United States as the dominant power in the current cycle. Where a pattern holds across Western democracies, international data is noted. Where a finding is US-specific, the text says so. The macro-cycle and financial frameworks (Dalio, Turchin) and the IMF reserve data are applied globally.
A note on “empire cycles”
“Empire cycles” is the report’s plain-language shorthand for the structural rise-and-fall dynamics that the academic literature models as secular cycles and structural-demographic theory. The plainer term is a deliberate choice for a general reader. It carries no claim beyond what the cited frameworks support.
A note on the word “report”
This document synthesises existing scholarship. It collects no primary data. It is therefore described throughout as a report, not as research.
Track 1: Empire and Financial Cycles
Part I: The Frame
In brief. Three independent frameworks, built by a hedge fund manager, a complexity scientist, and two generational historians, place the United States in the late, unstable phase of long historical cycles. The financial and social indicators those frameworks track are moving in the directions they predict. The historical cases show what such phases do to ordinary people: the relationship between effort and reward breaks, trust in official accounts collapses, and communities fragment or reorganise around new identities.
The Mechanism
Great powers rise and decline in patterns that recur across centuries. The frameworks that model these patterns differ in method and rigour, but they describe a similar causal chain. A dominant power accumulates privileges, most importantly the ability to borrow cheaply in its own currency. That privilege funds consumption rather than productive investment. Gains concentrate at the top while median incomes stagnate. Competition among elites intensifies as the number of aspirants outgrows the positions available. Public finances deteriorate. Trust in shared institutions erodes, and internal conflict rises until a crisis forces a reset.
Track 1 establishes where the United States sits in that chain as of 2026. It supplies the macro conditions under which every other track operates. It does not explain what fills the vacuum when trust fails; that is the subject of Tracks 2 and 3.
The Evidence Base
Three frameworks
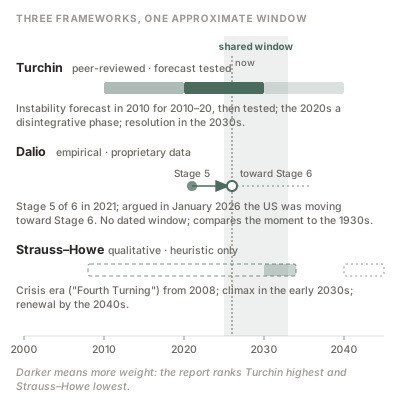
Ray Dalio’s Big Cycle. In The Changing World Order (2021)[6], Dalio analyses roughly 500 years of data on major empires, including the Dutch, British, and American cases and successive Chinese dynasties. He identifies eight measures of national strength (education, competitiveness, innovation and technology, economic output, share of world trade, military strength, financial-centre status, and reserve-currency status) and argues that they rise and fall in a characteristic order. Education leads the ascent. Reserve-currency status is the last to rise and the last to fall. Dalio describes a long-term debt cycle of roughly 50 to 75 years nested inside a broader imperial arc, and places the United States in Stage 5 of a six-stage internal order cycle: a phase of bad finances, wide wealth gaps, and intensifying conflict. In January 2026 he argued publicly that political violence and fiscal deterioration together suggested movement towards Stage 6, citing his own 2021 observation that bankrupt government finances combined with large wealth gaps are the most reliable leading indicator of civil conflict (Fortune, 26 January 2026)[7]. In a May 2024 interview with the Financial Times, he put the probability of civil war in the United States at 35 to 40 per cent. These are one analyst’s judgements, not model outputs, and the report cites them as such. On the historical pattern On the current assessment The specific current assessment rests on proprietary data and personal judgement.
Peter Turchin’s structural-demographic theory. Turchin, a complexity scientist, models two interacting timescales: a secular cycle of two to three centuries alternating between integrative and disintegrative phases, and a shorter oscillation of political violence of roughly fifty years (Ages of Discord, 2016; End Times, 2023)[23]. His central engine is the “wealth pump”: when elites capture a growing share of economic gains while wages stagnate, popular immiseration coincides with elite overproduction, meaning more credentialed aspirants than positions of power. Frustrated counter-elites then channel popular resentment against the establishment. Turchin combines measures of mass mobilisation potential, elite mobilisation potential, and state fiscal distress into a Political Stress Indicator. In a 2010 letter to Nature[25] he projected that the decade 2010 to 2020 would bring rising instability in the United States and Western Europe. A retrospective in PLOS ONE by Turchin and Andrey Korotayev (2020)[26], using the Cross-National Time-Series Data Archive, found that anti-government demonstrations and riots increased sharply over that decade in the US, the UK, and several major Western European countries. It is the only framework of the three to have made a dated, out-of-sample forecast and tested it. Strong evidence The critique that the index has circularity in its construction is noted under What Is Not Known.
Strauss–Howe generational theory. William Strauss and Neil Howe (The Fourth Turning, 1997)[21] propose a saeculum of roughly eighty years divided into four “turnings” of about twenty years each: High, Awakening, Unravelling, and Crisis. Howe (The Fourth Turning Is Here, 2023)[14] dates the current Crisis from the 2008 financial crisis, projects its climax in the early 2030s, and forecasts renewal by the 2040s. Turchin has criticised the framework as closer to prophecy than testable science[24]. The report uses it only as a heuristic. Contested
The three frameworks were built independently, with different methods and different data. Their agreement on the approximate window (the mid-2020s to the early 2030s) is the reason Track 1 exists. Agreement between frameworks of unequal rigour is not proof, and the report weights them accordingly: Turchin highest, Dalio next, Strauss–Howe lowest.
| Dimension | Dalio | Turchin | Strauss–Howe |
|---|---|---|---|
| Current US position | Stage 5 of 6, possibly moving to 6 | Disintegrative phase | Fourth Turning since 2008 |
| Crisis window | Comparable to the 1930s | 2020s, resolution in 2030s | Climax early 2030s |
| Core mechanism | Debt cycle and wealth gaps | Wealth pump and elite overproduction | Generational forgetting |
| Testability | Empirical, proprietary | Peer-reviewed, forecast tested | Qualitative |
The current indicators
Reserve-currency position. The IMF’s Currency Composition of Official Foreign Exchange Reserves (COFER) shows the dollar’s share of allocated global reserves at 57.1 per cent in the first quarter of 2026, up slightly from 56.4 per cent at the end of 2025 (IMF COFER Data Brief, July 2026)[15]. The IMF re-based the series in the third quarter of 2025, with revisions back to 2000, so comparisons with older published figures of around 70 per cent at the turn of the century should be made against the revised series. The decline since 2000 is real and long-running. Recent quarterly movements are largely driven by exchange-rate valuation rather than active diversification. The Chinese renminbi remains a small share of reserves. On direction On magnitude
The more telling signal is gold. The World Gold Council[31] reports central-bank purchases above 1,000 tonnes in each of 2022, 2023, and 2024, roughly double the annual average of the preceding decade. In 2025 gold overtook US Treasuries as a share of official foreign reserves, largely because of the rise in the gold price rather than new buying (European Central Bank, The international role of the euro, June 2026)[8]. The pattern indicates hedging against dollar risk, not a collapse of the dollar system. Strong evidence
Wealth concentration. The Piketty–Saez series[17] shows the top 1 per cent share of pre-tax market income (including capital gains) roughly doubling between 1980 and 2000 and remaining near that level since, and the top 10 per cent share passing 50 per cent in the 2010s, above its late-1920s peak. The Census Bureau’s Gini index for household income[27] rose from 0.397 in 1967 to about 0.49 in 2024, among the highest readings in the series, with almost all of the increase after 1980. Raj Chetty and colleagues (Science, 2017)[4] found that the share of Americans earning more than their parents at age thirty fell from about 92 per cent for those born in 1940 to about 50 per cent for those born in the 1980s, and that changes in the distribution of growth, not the rate of growth, explain most of the decline. Gerald Auten and David Splinter[1], economists at the US Treasury and the Joint Committee on Taxation, produce an alternative series that finds roughly half the increase in top income shares reported by Piketty and Saez. The dispute concerns magnitude. Neither series disputes the direction. Direction Magnitude contested
Public finances. The Congressional Budget Office (Budget and Economic Outlook: 2026 to 2036)[5] puts federal debt held by the public at 99 per cent of GDP at the end of 2025, projects 101 per cent for 2026, and 120 per cent by 2036. Gross federal debt, which includes debt held by government trust funds, is higher, above 120 per cent of GDP; the two measures are often confused in public commentary, and this report uses debt held by the public unless stated otherwise. Net interest costs reach about $1.0 trillion in 2026, equal to 18.6 per cent of federal revenue, and CBO projects 25.8 per cent by 2036. Moody’s removed the United States’ last AAA rating in May 2025[16], completing the downgrade by all three major agencies. Strong evidence
Institutional trust. Pew Research Center’s series[18], which began in 1958, shows trust in the federal government to do what is right “just about always” or “most of the time” falling from 77 per cent in 1964 to 17 per cent in September 2025. Gallup’s 2026 confidence-in-institutions survey[12] puts average confidence across major institutions at 27 per cent, the fifth consecutive year below 30 per cent; confidence in Congress stands at 9 per cent. Gallup notes that each downturn in the series since the 1970s has bottomed out lower than the one before, with recoveries that have rarely restored confidence to previous highs. Strong evidence The length and methodological consistency of these series make them among the strongest evidence in the report. Figure 14, in Track 7, plots the full Pew series.
Social stress. Congressional roll-call voting measured by the DW-NOMINATE method (Voteview, UCLA)[29] shows polarisation at its highest level since the late nineteenth century, with near-zero ideological overlap between the parties. The Economic Policy Institute[2] estimates that median compensation would be substantially higher had it tracked productivity growth since 1973. US life expectancy fell in 2015, held level in 2016 and fell again in 2017, the first sustained decline in a century outside of pandemic years (CDC, National Center for Health Statistics)[28]. Anne Case and Angus Deaton (Deaths of Despair and the Future of Capitalism, 2020)[3] trace much of that decline to rising deaths from drugs, alcohol, and suicide among Americans without a university degree. Strong evidence The consequences for health and relationships are developed in Tracks 4 and 5.
What empire transitions do to people
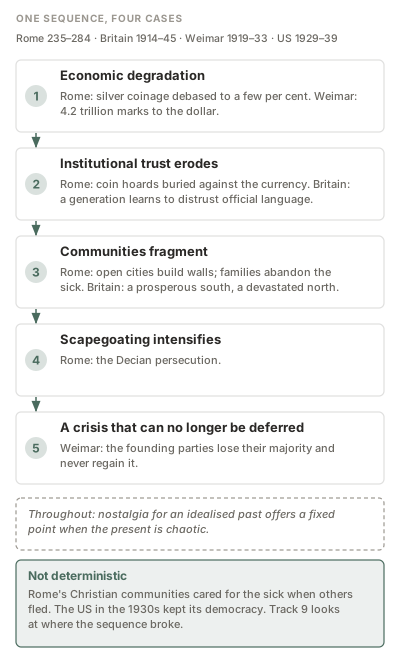
Financial and political analyses of decline usually omit behaviour. The historical record does not. Four cases, chosen because they are well documented and span different eras and outcomes, show a recurring human sequence.
Rome, the third-century crisis (AD 235 to 284). Kyle Harper (The Fate of Rome, 2017)[13] documents the collapse of the silver content of Roman coinage, from near purity in the early empire to a few per cent by the 260s and 270s. Coin hoards buried across the provinces in this period record people storing value against a currency they no longer trusted. Cities that had stood open for centuries built defensive walls. Pontius, the deacon and biographer of Cyprian of Carthage, described families abandoning the sick during the plague of the 250s[19]. Decius’s order of 249 or 250 that all inhabitants sacrifice to the gods became the first empire-wide persecution of Christians (James Rives, Journal of Roman Studies, 1999)[20], and it coincided with the plague’s outbreak. The same crisis also produced the opposite response: Christian communities, by their own account, cared for the sick when others fled (Dionysius of Alexandria, quoted in Eusebius, Ecclesiastical History 7.22)[9]. The report reads this as part of a broader shift from civic identity to religious community as imperial institutions failed. Strong evidence
Britain, 1914 to 1945. On the first day of the Battle of the Somme, 1 July 1916, the British Army suffered roughly 19,000 dead. Paul Fussell (The Great War and Modern Memory, 1975)[11] argues that the gap between official language about the war and the experience of the trenches produced a lasting shift towards irony as the dominant mode of public discourse: a generation learned to distrust official language as a habit. The interwar years divided Britain into a prosperous south and a devastated industrial north. Ellen Wilkinson (The Town That Was Murdered, 1939)[30] recorded unemployment in Jarrow at around 70 per cent after the closure of Palmer’s shipyard. Surface confidence before 1914 had masked visible fractures: mass strikes, suffragette militancy, and the Irish Home Rule crisis of the years historians call the Great Unrest. Strong evidence
Weimar Germany, 1919 to 1933. The three parties that founded the republic lost their combined parliamentary majority in the June 1920 election, seventeen months after the first, and never regained it. In 1923 the mark fell from around 18,000 to the dollar in January to 4.2 trillion by November. Adam Fergusson (When Money Dies, 1975)[10] documents the behavioural consequence: when prices doubled within days, the link between effort and reward broke, and the habits on which middle-class identity rested (saving, planning, deferring gratification) became irrational overnight. The social group most invested in the legitimacy of the system suffered most from its failure. Strong evidence
The United States, 1929 to 1939. Unemployment reached about 25 per cent in 1933. The US suicide rate reached its twentieth-century peak in 1932 (CDC, National Center for Health Statistics historical series). Studs Terkel’s oral histories (Hard Times, 1970)[22] record the Depression as a crisis of dignity as much as of income: shame often weighed heavier than deprivation. The American outcome differed from the German one. The report attributes the difference to a longer democratic tradition, institutions that remained broadly loyal to the constitutional order, and a leadership that offered a coherent public account of the crisis and the response. Track 3 examines how Roosevelt’s use of radio delivered that account. On the record On the comparison The comparative explanation is interpretive.
Across the four cases the same sequence recurs: economic degradation, erosion of institutional trust, community fragmentation, intensified scapegoating, and a political crisis that can no longer be deferred. In each, nostalgia for an idealised past offered a stable reference point when the present was chaotic. Synthesis The sequence is the report’s synthesis across cases, and it is not deterministic: Track 9 examines where the sequence broke.
Geographic Scope
The three frameworks are applied globally, and Dalio and Turchin both use multi-country historical data. The reserve-currency and debt indicators concern the United States as issuer of the dominant currency, with global consequences. The trust, inequality, polarisation, and mortality data are US-specific. Declining institutional trust and rising inequality are documented in many Western democracies, but at different rates and from different starting points, and the report does not assume the American figures generalise. The historical cases are European and American.
What Is Not Known
- The interaction between macro-cycle stress and algorithmic acceleration has not been formally studied. No framework in this track models how a changed information environment alters the speed of the cycle. Confirmed gap
- Turchin’s Political Stress Indicator has construction concerns. In the report’s reading, some inputs overlap with the outcomes the index is meant to predict. The 2010 forecast’s success is suggestive, not conclusive. Contested
- Strauss–Howe is not testable. It cannot account for permanent decline and is used here only as a heuristic. Contested
- Magnitude of reserve-currency decline. The direction is established; the size of recent moves is dominated by valuation effects and a re-based series.
- Timing. Structural conditions can be measured. The events that trigger a crisis cannot be predicted. Every framework here identifies a window, not a date.
Connection to Adjacent Tracks
Track 1 establishes that the United States is in a structurally unstable phase, one in which populations have historically become receptive to new explanations and new sources of authority as trust in existing ones fails. The consent thread begins here in its most basic form: as the systems governing people grow more complex and less trusted, the capacity to consent meaningfully to them weakens. Track 2 examines the infrastructure that was built, over the same century, to fill that space.
| Claim | Rating |
|---|---|
| Recurring rise-and-fall patterns in great powers | Strong evidence |
| Dalio’s current US assessment | Moderate evidence |
| Turchin’s 2010 forecast tested by 2020 retrospective | Strong evidence |
| Strauss–Howe as predictive framework | Contested |
| Reserve-currency decline, direction | Strong evidence |
| Reserve-currency decline, magnitude | Moderate evidence |
| Rising inequality, direction | Strong evidence |
| Rising inequality, magnitude | Contested |
| Debt and interest trajectory (CBO) | Strong evidence |
| Institutional trust decline (Pew, Gallup) | Strong evidence |
| Cross-case behavioural sequence | Synthesis |
| Macro-cycle and algorithm interaction | Confirmed gap |
Track 2: The Psychological Infrastructure
Part II: The Instrument
In brief. Over roughly a century, a set of techniques for influencing behaviour below the level of conscious deliberation was discovered, commercialised, industrialised, and finally automated. The progression ran from Freud’s consulting room to Bernays’s public relations office, to Madison Avenue’s research departments, to television political campaigns. It happened through institutional logic, not conspiracy. The report identifies eight psychological levers that recur at every stage. What changed over the century was the delivery system, the scale, and the distance between stimulus and response.
The Mechanism
Humans make most decisions through processes they cannot observe, then explain those decisions with reasons constructed afterwards. Anyone who can reliably reach those processes has a way of influencing choices that bypasses conscious resistance. Freud mapped that territory. Edward Bernays, his nephew, turned the map into a commercial and political service. The advertising industry of the 1950s institutionalised it. Television gave it a physiological delivery channel and brought it into electoral politics. By the 1980s, a mature and transferable toolkit existed, and Track 3 shows how software absorbed it.
Bernays named his project “the engineering of consent” in a 1947 essay of that title. The phrase contains the contradiction this report follows through every later track: consent that has been engineered is not consent.
The Evidence Base
What Freud found that survived
Most of Freud’s theoretical system has not held up. Three of his core observations have, and they are the ones that mattered for everything that followed.
Most mental processing is unconscious. John Bargh and Ezequiel Morsella (“The Unconscious Mind”, Perspectives on Psychological Science, 2008)[33] review evidence that several unconscious behavioural guidance systems operate continuously without conscious direction. Benjamin Libet’s experiments in the 1980s[52] found that the brain’s readiness potential precedes reported awareness of a decision to move by roughly a third of a second. Chun Siong Soon and colleagues (Nature Neuroscience, 2008)[67] used brain imaging to predict simple choices several seconds before participants reported making them. The interpretation of the Libet-style findings is disputed: Aaron Schurger and colleagues (PNAS, 2012)[64] argue that the readiness potential may reflect background neural noise rather than an unconscious decision. The broader finding, that much of the processing behind behaviour happens outside awareness, is not disputed. On the general claim On the timing experiments
People construct reasons after the fact. Richard Nisbett and Timothy Wilson (“Telling More Than We Can Know”, Psychological Review, 1977)[59] showed that people often cannot identify the real influences on their judgements, yet confidently give plausible explanations. Daniel Kahneman (Thinking, Fast and Slow, 2011)[49] describes a fast, automatic, emotional system whose conclusions a slower deliberate system often endorses rather than examines. Antonio Damasio’s somatic marker hypothesis (Descartes’ Error, 1994)[40] adds that emotion is a precondition of sound decision-making: patients with damage to emotion-processing regions make poor decisions despite intact reasoning. Strong evidence
Individual judgement degrades in groups. Freud’s Group Psychology and the Analysis of the Ego (1921)[46] built on Gustave Le Bon’s The Crowd (1895)[51], proposing that group members identify with one another through a shared attachment to a leader who stands in for their ideal self. The libidinal mechanism has no direct empirical support. Henri Tajfel’s minimal group experiments (1970 to 1971)[68] later showed that groups form and discriminate on the basis of arbitrary labels alone, without any leader. The broad observation, that people in groups become more suggestible and more hostile to outsiders, is well established. Moderate evidence
Freud’s later work, especially Civilisation and Its Discontents (1930), carried a deep pessimism about mass behaviour. If people are driven by impulses they cannot see, and regress in crowds, then the premise of rational democratic self-government looks fragile. That intellectual climate made managing the public seem not only possible but responsible.
Bernays turned theory into a service
Edward Bernays (1891 to 1995) was Freud’s nephew twice over: his mother was Freud’s sister and his father was the brother of Freud’s wife. He arranged the American publication of Freud’s General Introduction to Psychoanalysis in the early 1920s.
His training ground was the Committee on Public Information, the US government’s First World War propaganda agency. George Creel, its chairman, reported (How We Advertised America, 1920; Complete Report of the Chairman of the Committee on Public Information, 1920)[39] that roughly 75,000 volunteer “Four Minute Men” delivered more than 750,000 short speeches to audiences totalling an estimated 314 million. After the war Bernays set out to apply the same methods in peacetime and opened a consultancy in 1919.
Bernays stated his argument openly. Propaganda (1928)[34] opens by asserting that the conscious manipulation of the habits and opinions of the masses is an important element of democratic society, and that those who operate this unseen mechanism form an invisible government. His reasoning was structural: modern society was too complex for citizens to judge every question themselves, so specialists would sift information for them. Crystallizing Public Opinion (1923) described the working method, which included creating events rather than merely announcing them. Daniel Boorstin (The Image, 1961)[37] later named such staged occasions “pseudo-events”.
Three campaigns show the method.
- “Torches of Freedom” (1929). For the American Tobacco Company, Bernays arranged for young women to smoke publicly during the Easter parade on Fifth Avenue, presented as a gesture for women’s liberation, and briefed the press in advance. The New York Times reported it as a protest for freedom. The cigarette was sold as a symbol, not a product. Vanessa Murphree (2015)[58] finds that press coverage of the march, though significant, was far less celebratory than Bernays later claimed, and that its impact has been overstated. The method is documented regardless of its measured effect. On the campaign On its impact
- The hearty breakfast campaign (1920s). For the Beech-Nut Packing Company, Bernays surveyed physicians on whether a heavier breakfast was healthier and, by his own later account, publicised that roughly 4,500 of 5,000 agreed. The endorsement of trusted intermediaries did the persuading. Campaign Figures (Bernays’s own account; see also Larry Tye, The Father of Spin, 1998)[69]
- Guatemala (1950s). For the United Fruit Company, Bernays ran a multi-year campaign that recast Guatemala’s elected president, Jacobo Árbenz, as a communist threat in the American press, using a front organisation and sponsored journalist tours. Stephen Schlesinger and Stephen Kinzer (Bitter Fruit, 1982)[62] document the campaign and the CIA-backed coup that removed Árbenz in June 1954. Bernays had no role in the military operation. His campaign shaped the political climate in which it was accepted. Strong evidence
Joseph Malherek (Psychoanalysis and History, 2023)[53] argues that Bernays’s real skill was publicity rather than psychoanalysis, and that he cultivated the Freud connection for its prestige. Bernays was also an energetic self-promoter; his own claim, in his memoir Biography of an Idea (1965), that Joseph Goebbels used his books is uncorroborated beyond that account. These caveats limit claims about Bernays’s intellectual depth. They do not change what he did or the industry that followed him. Strong evidence
Madison Avenue industrialised it
Ernest Dichter brought depth psychology into market research. A Vienna-trained psychologist who emigrated in 1938, he set up his own consulting firm in 1946, later named the Institute for Motivational Research, and used long, therapy-like interviews to uncover why people bought things. His premise was that products carry psychological meaning and are bought for the identities they express. His best-known recommendation, that instant cake mixes should require a fresh egg so that the baker felt a sense of contribution, has been questioned by Laura Shapiro (Something from the Oven, 2004)[65]. His methods and their adoption are well documented. Strong evidence
Vance Packard’s The Hidden Persuaders (1957)[60] became a best-seller and described how “depth” psychologists had entered the advertising industry. Michael Schudson (Advertising, the Uneasy Persuasion, 1984)[63] countered that advertising is far less powerful than either its practitioners or its critics claimed. That debate remains open. What is not in dispute is that the industry institutionalised the attempt to reach unconscious motivation at scale. On effect size On institutional adoption
The shift from selling products to selling identities can be dated. In the mid-1950s the Leo Burnett agency repositioned Marlboro, previously marketed to women, around the image of the cowboy; it went on to become the world’s best-selling cigarette (Smithsonian National Museum of American History, Marlboro Oral History and Documentation Project)[66]. In 1959 Doyle Dane Bernbach’s “Think Small” campaign for Volkswagen made ownership a statement about the kind of person who did not need to show off. Thomas Frank (The Conquest of Cool, 1997)[44] shows that advertising’s own creative rebellion against conformity anticipated the 1960s counterculture rather than following it. In 1978 SRI International launched VALS, a system that segmented consumers by psychological type rather than demographics. Stuart Ewen (Captains of Consciousness, 1976)[41] describes the resulting logic: generate dissatisfaction with the present self, offer a product as a bridge to an aspirational self, deliver brief satisfaction, and begin again. Strong evidence
Television brought it into politics
Marshall McLuhan (Understanding Media, 1964)[55] argued that a medium reshapes cognition independently of what it carries. His specific theory is widely criticised as loose. The broad claim, that the form of a medium matters, has held up. Herbert Krugman (Journal of Advertising Research, 1971)[50] recorded a shift in one participant’s brain activity from beta waves, associated with alert attention, towards alpha waves, associated with relaxed receptivity, within about thirty seconds of watching television. It was a single-subject study and its interpretation is limited. Moderate evidence Neil Postman (Amusing Ourselves to Death, 1985)[61] argued that television turned public discourse into entertainment and flooded viewers with information they could not act on. As cultural analysis Not empirically testable in the usual sense.
The techniques entered electoral politics in 1968. Joe McGinniss (The Selling of the President, 1969)[54], writing from inside Richard Nixon’s campaign, documented advertising professionals applying commercial methods to a candidate: controlled studio events presented as open forums, advertising built from still images and mood, and a strategic preference for image over policy. The team included Roger Ailes, then a young television producer. Under Ronald Reagan, Michael Deaver made the visually composed photo opportunity a routine instrument of the presidency. The 1988 campaign advertising around the furlough of William Horton showed the anxiety lever operating through paid and earned media at national scale. Strong evidence
Eight levers that recur at every stage
The report identifies eight psychological mechanisms that appear, in the same form, at every stage of the lineage. Each rests on well-replicated experimental evidence. The claim that they operate identically across eras and platforms is the report’s synthesis. Synthesis
| # | Mechanism | Experimental foundation | First systematic commercial or political use |
|---|---|---|---|
| 1 | Emotional bypass of deliberate evaluation | Kahneman; Damasio | Bernays, 1920s |
| 2 | Identity attachment | Kahan, identity-protective cognition | Lifestyle advertising, 1950s |
| 3 | Tribal belonging | Tajfel, minimal groups (1970–71) | Wartime and political propaganda |
| 4 | Anxiety as motivator | Festinger, social comparison (1954)[42] | Problem-and-remedy advertising, 1920s |
| 5 | Manufactured social proof | Asch, conformity (1951); Cialdini (1984)[38] | Testimonial and endorsement advertising |
| 6 | The aspiration gap | Higgins, self-discrepancy (1987)[47] | Consumer advertising, 1920s onward |
| 7 | Variable reward schedules | Skinner; Ferster & Skinner (1957)[43] | Gambling machines |
| 8 | Authority transfer | Milgram, obedience (1961–62) | Bernays’s third-party endorsements |
Three of the experimental foundations deserve their numbers. In Solomon Asch’s conformity experiments (1951)[32], about three quarters of participants went along with an obviously wrong group answer at least once, and conformity occurred on about a third of critical trials; Andreas Franzen and Sebastian Mader (PLOS ONE, 2023)[45] replicated a conformity rate of about a third seventy years later. In Stanley Milgram’s baseline obedience condition (1963)[56], 65 per cent of participants continued to the maximum shock level on the instruction of an experimenter; obedience fell sharply when the experimenter gave his orders by telephone instead of in person (Milgram, Obedience to Authority, 1974)[57]. Dan Kahan’s work at Yale’s Cultural Cognition Project[48] found that people with greater scientific literacy are often more polarised on contested scientific questions, not less, because protecting standing in one’s group can matter more to an individual than being right about an abstract question. Strong evidence
The mechanisms matter less individually than in combination. In the broadcast era a campaign might deploy one or two of them through one channel at one moment. Track 3 shows what happened when all eight were built into software that runs continuously for each individual.
Geographic Scope
The lineage is largely American, with European intellectual origins (Freud, Le Bon, Dichter). The conformity and obedience experiments have been replicated across many countries and cultures, though conformity rates vary (Rod Bond and Peter Smith, Psychological Bulletin, 1996; Thomas Blass, Social and Personality Psychology Compass, 2012)[35][36]. The techniques spread internationally through the advertising and public relations industries from the 1950s onward; the political applications documented here are American.
What Is Not Known
- How powerful these techniques are in the field. The “strong effects” and “limited effects” schools in advertising and communication studies have not been reconciled. Laboratory effects replicate; real-world magnitudes are harder to establish. Contested
- The degree to which Bernays drew on psychoanalysis rather than borrowing its prestige. Contested
- Whether the eight mechanisms form a complete set. The list is the report’s analytical grouping, not a taxonomy from the literature. Synthesis
- The internal documents released by Frances Haugen in 2021, discussed in Track 3, are the strongest evidence that at least some of these mechanisms operate at large scale, because the company’s own researchers measured them.
Connection to Adjacent Tracks
Track 1 described populations under structural stress, with trust in institutions failing. Track 2 shows that during the same century a toolkit was built for influencing behaviour beneath deliberate judgement, and that its first great theorist described his work as engineering consent. Track 3 follows the toolkit into software, where the delivery system changed in kind as well as in scale.
| Claim | Rating |
|---|---|
| Most mental processing is unconscious | Strong evidence |
| Interpretation of Libet-style timing studies | Contested |
| Post-hoc rationalisation of decisions | Strong evidence |
| Freud’s group mechanism | Moderate evidence |
| Bernays’s methods and campaigns | Strong evidence |
| Madison Avenue adoption of motivational research | Strong evidence |
| Size of advertising effects | Contested |
| Television’s physiological effect (Krugman) | Moderate evidence |
| Political adoption of commercial techniques | Strong evidence |
| Each of the eight mechanisms, experimentally | Strong evidence |
| Eight mechanisms operating identically across eras | Synthesis |
Track 3: Technology as Delivery Mechanism
In brief. Every medium since the penny newspaper has sold its audience’s attention to advertisers. Each new technology discovered which of the eight mechanisms its architecture amplified most, then optimised for them. Between 2006 and 2012, social platforms encoded all eight into software that runs continuously, personalised to each user. A preregistered field experiment published in Science in 2025 found that re-ranking a social feed for ten days shifted political hostility by an amount comparable to about three years of change in national surveys, and that the effect ran in both directions. Newer peer-reviewed work describes a further shift, from capturing attention to shaping habits, identity, and dependence.
The Mechanism
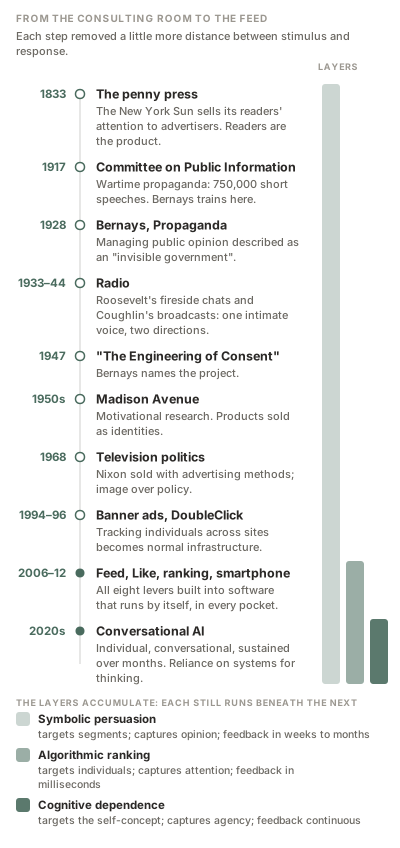
The business model came before the technology. Tim Wu (The Attention Merchants, 2016)[89] traces it to Benjamin Day’s New York Sun, launched in 1833 at a penny a copy, below cost, and funded by selling its readers’ attention to advertisers. Readers were the product. Every later medium inherited the model, and competition for attention pulls content towards whatever holds it longest, which is usually whatever provokes the strongest emotion.
Each technology then removed a little more of the distance between stimulus and response. Radio brought an intimate human voice into the home. Television added vision and a passive posture. The early internet added tracking and targeting. Social platforms added continuous personalised ranking, and smartphones put it in every pocket. Each reduction in friction also reduced the space in which a person could stop, notice what was being done, and decide. That is the sense in which the report says the delivery system progressively removed the conditions for consent.
The Evidence Base
Radio: one voice, two directions
By the early 1940s most American households owned a radio. Franklin Roosevelt’s fireside chats (1933 to 1944) used the medium’s intimacy deliberately: he spoke conversationally rather than orating, and listeners wrote to him describing a sense of personal connection. The chats let him reach voters without passing through newspapers. Strong evidence
Father Charles Coughlin used the same medium in the same years with the opposite content. His weekly broadcasts reached an audience estimated in the tens of millions at their peak; he moved from supporting Roosevelt to promoting antisemitic conspiracy theories and a militant organisation, the Christian Front. Tianyi Wang (American Economic Review, 2021)[88] used differences in radio signal strength driven by terrain as a natural experiment and found that stronger Coughlin reception led to lower support for Roosevelt and, once his broadcasts turned openly antisemitic in 1938 and 1939, to more local chapters of the pro-Nazi German American Bund and, during the war, lower purchases of war bonds. Radio stations began refusing to carry Coughlin after his broadcast following Kristallnacht in November 1938. The debate that followed, about private platforms, free speech, and responsibility for harm, anticipated the arguments of the 2020s almost exactly. Strong evidence
Radio amplified the emotional bypass and authority transfer levers (1 and 8) above all, and had no preference between truth and falsehood.
Television
Track 2 covered television’s role in consumer identity advertising and in political campaigning, and that material is not repeated here. The delivery point for this track is structural: television made the audience physically passive and simultaneous, and it made visual presentation decisive in politics. It amplified emotional bypass, identity attachment, the aspiration gap, and authority transfer (1, 2, 6, 8). On the physiological claim On the political record
The early internet: tracking arrives
The first banner advertisement, for AT&T on HotWired in October 1994, achieved a click-through rate of about 44 per cent, according to G.M. O’Connell, founder of Modem Media, the agency that made it. Industry averages for display advertising now run at a small fraction of one per cent (WordStream, 2026)[80]. The decline measures how quickly human attention adapts to a new intrusion and filters it out, which in turn pushes the industry to escalate. DoubleClick, launched in 1996, built the infrastructure that let advertisers track individuals across websites. Pop-up advertising (1997) provoked browsers to block it within a few years. Google AdWords (2000) produced advertisements that were often useful. Strong evidence
Three lasting conventions came out of this period: behavioural tracking as normal infrastructure, free services funded by advertising as the default, and the click as the primary metric, which rewards triggering action over conveying value.
Social platforms: the mechanisms become software
Between 2006 and 2012 four decisions turned the eight mechanisms from techniques that people deployed into code that runs by itself.
The News Feed (September 2006). Facebook replaced a directory of profile pages with a continuous stream of friends’ activity. Users protested in large numbers, organising through the feature itself. The company kept it, and the protests faded.
The Like button (February 2009). Facebook introduced the Like as a one-click signal of approval. It gave the company a data stream on what each user valued and turned every post into a small, unpredictable test of social approval: a variable reward schedule (mechanism 7) built into social life.
Ranking by engagement (from 2009). Facebook moved from a chronological feed towards ranking posts by predicted interaction. The logic was defensible, since users could not read everything. The effect was to hand the question of what people see to a system optimising for engagement. Engagement and wellbeing are different quantities. Content charged with moral emotion, or hostile to a political out-group, tends to generate more interaction (William Brady and colleagues, PNAS, 2017; Steve Rathje, Jay Van Bavel and Sander van der Linden, PNAS, 2021)[70][87].
Smartphone ubiquity (around 2012). Pew Research Center data[84] shows smartphone ownership among American adults passing half in 2013 and rising to about nine in ten by the 2020s. The feed moved from the desk to the pocket, and checking moved from periodic to continuous.
The people who built these systems understood what they were doing. Sean Parker, Facebook’s founding president, told Axios in November 2017[83] that the design question had been how to consume as much of users’ time and attention as possible, that the answer was a social-validation feedback loop, and that it exploited a vulnerability in human psychology. He said the founders understood this consciously and did it anyway. Primary source
The documents Frances Haugen disclosed in 2021[78] showed the mechanisms at work inside one company. In 2017 Facebook’s ranking system gave emoji reactions, including “angry”, five times the weight of a Like; internal researchers found that posts drawing angry reactions were disproportionately likely to contain misinformation and toxicity. When the company later reduced the weight of the angry reaction to zero, users saw less misinformation and less graphic content, with no measurable fall in overall activity (Washington Post, 26 October 2021). Internal research on Instagram found that among teenagers in the UK who reported suicidal thoughts, 13 per cent traced the start of those thoughts to the app, and 6 per cent in the US (Wall Street Journal, September 2021). In 2016 the company’s own engineering blog said its machine-learning prediction service made more than six million predictions per second (Facebook Engineering, May 2016)[85]. Strong evidence
| Mechanism | How it was encoded in software |
|---|---|
| 1. Emotional bypass | Ranking weights that favour high-arousal reactions |
| 2. Identity attachment | Personalised feeds that reinforce existing identity markers |
| 3. Tribal belonging | Recommendation systems that serve in-group content |
| 4. Anxiety | Comparison mechanics, notifications, fear of missing out |
| 5. Social proof | Visible like counts, share counts, follower numbers |
| 6. Aspiration gap | Curated feeds, filters, influencer economies |
| 7. Variable rewards | Pull-to-refresh, infinite scroll, unpredictable notifications |
| 8. Authority transfer | Verification badges, parasocial influencer relationships |
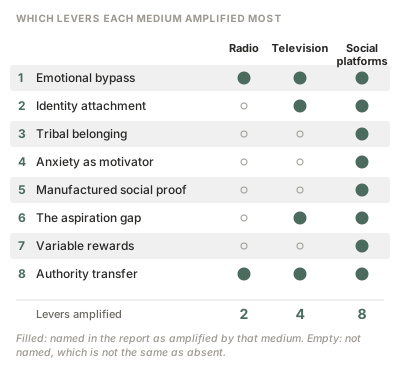
Tribal amplification has measurable consequences. Karsten Müller and Carlo Schwarz (“Fanning the Flames of Hate”, Journal of the European Economic Association, 2021)[82] studied Germany between 2015 and 2017 and found that anti-refugee posts on the far-right AfD’s Facebook page predicted attacks on refugees in municipalities with high Facebook use. During major internet and Facebook outages, the link disappeared. The authors are explicit that social media is one factor among many, acting as a propagation mechanism. Strong evidence
Algorithm 2.0: precision, and a measured effect
After 2012 the change was one of precision. Targeting moved from categories of people towards individuals at particular moments.
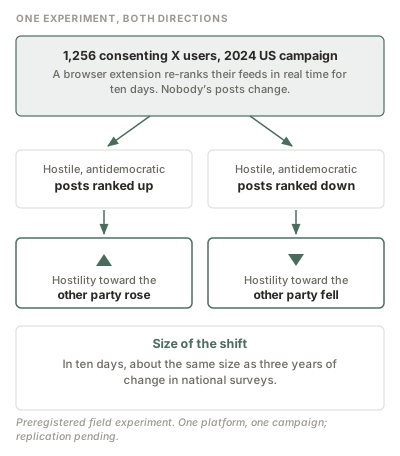
The strongest single piece of evidence on what feed ranking does comes from Tiziano Piccardi and colleagues (Science, 2025)[86]. In a preregistered field experiment during the 2024 US presidential campaign, 1,256 consenting participants used X with a browser extension that re-ranked their feeds in real time, raising or lowering the position of posts expressing antidemocratic attitudes and partisan hostility. Over ten days, feeds that increased exposure to such content raised participants’ hostility towards the opposing party; feeds that reduced exposure lowered it. The authors describe the size of the shift as comparable to roughly three years of change in American affective polarisation as measured by national surveys. On the finding On generalisation Generalisation beyond one platform, one campaign, and one short period is pending replication.
Two points follow. Ranking choices alone, without any change in what people post, move political hostility measurably and fast. And the effect runs both ways, which means the outcome is a design decision rather than an inevitability. Track 6 and the Convergence Risk Assessment both return to that second point.
Shoshana Zuboff (The Age of Surveillance Capitalism, 2019)[90] describes the commercial trajectory as moving from monitoring behaviour, to predicting it, to intervening to shape behaviour towards outcomes that pay. She describes the rise of what she calls the means of behavioural modification. As an influential framework Its broader claims are debated (Evgeny Morozov, “Capitalism’s New Clothes”, The Baffler, 2019)[81].
Beyond attention: habits, identity, and dependence
A body of peer-reviewed work since 2023 argues that the current systems do something qualitatively different from persuasion at scale.
- Shaping will, not only watching behaviour. Pablo González de la Torre, Marta Pérez-Verdugo, and Xabier Barandiaran (AI & Society, 2026)[74] argue that platforms do not merely surveil users but “surwill” them: they shape and organise behaviour through attentional capture and encourage habits that weaken the coherence of a person’s own agency. On this account, what is harvested is no longer only time or data but the capacity for self-directed action.
- Cognitive lock-in. M. Hansen (“From attention economy to cognitive lock-ins”, Big Data & Society, 2024)[77] argues that the economic logic is shifting from capturing attention towards creating computational dependencies, in which people rely on systems for synthesis, memory, and judgement they previously performed themselves. Large language models extend that dependence.
- The algorithmic self. Jeena Joseph (Frontiers in Psychology, 2025)[79] describes identity and self-understanding increasingly formed through interaction with recommendation and predictive systems, including the outsourcing of self-reflection to algorithmic summaries of one’s own moods and preferences.
- Attention as mental integrity. Bartek Chomanski (Neuroethics, 2023)[72] argues that a right to attention follows from a right to mental integrity, analogous to bodily integrity, while leaving open whether current attention-capturing business practices routinely violate it.
As peer-reviewed arguments These are primarily conceptual and theoretical contributions; the empirical measurement of dependence and identity effects at population scale remains thin. On empirical magnitude
The report groups these developments into three stacked layers. Synthesis
| Dimension | Symbolic persuasion (Bernays onward) | Algorithmic ranking | Cognitive dependence |
|---|---|---|---|
| Target | Demographic segments | Individuals in real time | The self-concept |
| Method | Symbolic association | Behavioural prediction | Reliance and habit formation |
| What is captured | Opinion | Attention | Agency |
| Feedback speed | Weeks to months | Milliseconds | Continuous |
The layers accumulate. Symbolic association still runs beneath algorithmic ranking, which still runs beneath the newer dependence.
Chomanski’s grounding of attention in mental integrity bears on the consent problem. You cannot give informed consent to a system whose operations are opaque, whose data collection you cannot see, and whose effects on your judgement you cannot measure, particularly when the faculty you would use to evaluate it is the one being shaped. Synthesis
The contested evidence
The popular account of social media harm is more contested than public debate suggests, and the report states that directly.
Chris Bail (Breaking the Social Media Prism, 2021)[73] finds that only a small minority of users live in true echo chambers, and a collaborative review of the literature compiled by Bail and Jonathan Haidt[76] found that most studies on echo chambers reported no evidence or inconclusive results. Research by Brendan Nyhan and colleagues on YouTube (Chen, Nyhan, Reifler, Robertson, and Wilson, Science Advances, 2023)[71] found that exposure to extremist content was concentrated among a small group of users who already held strong resentment and sought it out through subscriptions and external links, rather than being led there by recommendations. Andrew Guess and colleagues, in a set of experiments with Meta during the 2020 US election (Science, 2023)[75], found that switching users to chronological feeds for three months changed what they saw but did not measurably change their political attitudes.
These findings sit uneasily alongside Piccardi and colleagues. One reading is that the Meta experiments changed the order of content from sources users had already chosen, while Piccardi and colleagues changed the prominence of a specific class of hostile content; the two designs test different interventions. Another reading is that effects are real but vary by platform, period, and population. The report does not resolve this. Contested
What the counter-evidence does not touch is the structural layer: attention sold without meaningful consent, identity and self-reflection increasingly mediated by systems optimising for engagement, and growing dependence on those systems for thinking. The report treats the dramatic surface harms (echo chambers, radicalisation spirals) as symptoms whose size is disputed, and the structural mechanisms as the more durable pattern beneath them. Synthesis
Geographic Scope
The platform timeline and the internal company documents are global in reach but mostly concern US companies. The Coughlin, Piccardi, Guess, and YouTube studies are American. Müller and Schwarz is German. The Instagram research cited from the Haugen documents concerns UK and US teenagers. The theoretical work on dependence and identity is international and not country-specific.
What Is Not Known
- Replication of feed-ranking effects. Piccardi and colleagues is a single preregistered experiment on one platform during one campaign. Moderate evidence
- Reconciliation of the experimental literature. Why some large experiments find attitude effects and others do not is unresolved. Contested
- Population-scale measurement of dependence and identity effects. The frameworks are strong; the longitudinal data is thin. Confirmed gap
- Current ranking practices. Platforms change ranking systems continually and disclose little. Findings based on 2017 to 2021 documents may not describe systems in 2026. Confirmed gap
Connection to Adjacent Tracks
Track 2 built the toolkit. Track 3 shows it encoded into software that runs continuously for each person, with each generation of technology removing more of the space in which deliberate consent can operate. Track 4 asks what more than a decade of continuous exposure has done to the human body and brain.
| Claim | Rating |
|---|---|
| Attention-resale business model since 1833 | Strong evidence |
| Radio’s measurable effects (Coughlin) | Strong evidence |
| Social platform design decisions, 2006–2012 | Strong evidence |
| Designers understood the psychological mechanism (Parker) | Strong evidence |
| Internal Facebook findings (Haugen documents) | Strong evidence |
| Social media as propagation mechanism for hate crime (Germany) | Strong evidence |
| Feed ranking shifts partisan hostility, both directions (Piccardi et al.) | Finding Generalisation |
| Echo chambers and radicalisation spirals as mass phenomena | Contested |
| Shift towards dependence and identity shaping, as argument | Strong evidence |
| Same, as measured population effect | Moderate evidence |
| Three-layer stack | Synthesis |
Track 4: Physiological Consequences
Part III: The Cost
In brief. The body’s stress system is built for threats that arrive and then pass. The environment described in Track 3 produces low-grade activation that rarely ends: comparison, uncertainty, outrage, and interruption across every waking hour. Chronic activation of this kind has well-documented costs, collectively called allostatic load, including disrupted cortisol rhythms, poorer sleep, inflammation, and measurable changes in the brain regions responsible for deliberate judgement and emotional regulation. The mechanisms are established. The specific causal contribution of digital environments to these outcomes at population scale is not yet measured, and the report keeps those two claims separate.
The Mechanism
Bruce McEwen and Eliot Stellar (“Stress and the Individual”, Archives of Internal Medicine, 1993)[108] introduced the term allostatic load for the cumulative wear on the body produced by repeated or prolonged stress responses. The healthy response, allostasis, is short: a threat is detected, the body mobilises, the threat passes, and systems return to baseline. Load accumulates when the return never fully completes.
The link to Tracks 2 and 3 is the pattern of exposure, not its intensity. Comparison anxiety, unpredictable social reward, identity threat, and outrage are individually mild. Delivered continuously through a device that is always within reach, they supply the condition allostatic load describes: stress that never quite terminates. The report calls this a coherent mechanism. It does not claim that the scale of its contribution to population health has been measured.
The Evidence Base
Allostatic load
Allostatic load is measured as a composite of biomarkers across the neuroendocrine, cardiovascular, metabolic, and immune systems, such as cortisol, blood pressure, glucose regulation, and inflammatory markers including C-reactive protein and interleukin-6. Teresa Seeman and colleagues, studying high-functioning older adults in the MacArthur Studies of Successful Aging (Social Science & Medicine, 2004)[113], found that allostatic load accounted for roughly a third of the difference in mortality between people of higher and lower educational status. Strong evidence The concept is well validated over three decades; its application to adolescents is newer.
The cortisol system under chronic stress
When a stressor is detected, the hypothalamic–pituitary–adrenal (HPA) axis releases a cascade of hormones ending in cortisol. Cortisol mobilises energy and then, through negative feedback, switches off its own release. It follows a daily rhythm, peaking shortly after waking and declining through the day. Under chronic stress this regulation degrades. Feedback sensitivity falls, and over time the daily curve can flatten: a smaller morning peak and higher evening levels. A high, flat daily cortisol profile has been found in people facing traumatic and uncontrollable stressors (Gregory Miller, Edith Chen and Eric Zhou, Psychological Bulletin, 2007)[109]. Prolonged dysregulation is associated with a shift towards chronic low-grade inflammation, with impaired emotional regulation, and with elevated risk of depression and anxiety disorders. On the mechanism On digital attribution The specific attribution to digital exposure has not been isolated in longitudinal studies.
Sleep
Sleep is when the brain consolidates memory, regulates emotion, and restores hormonal and immune balance. Poor sleep raises allostatic load, and chronic stress disrupts sleep, so each worsens the other.
Screens disrupt sleep through three routes.
- Light. Brittany Wood and colleagues (Applied Ergonomics, 2013)[119] found that two hours of tablet use at full brightness in the evening suppressed melatonin by about 23 per cent. The effect is real but smaller than early coverage implied, and the field now treats light as one pathway among several. Moderate evidence
- Arousal. Emotionally engaging, socially uncertain content keeps the brain in a state of anticipation that works against the wind-down sleep requires. Variable social reward (mechanism 7) operates here directly. Emerging evidence The mechanism has convergent but still emerging evidence.
- Displacement. Device use takes time that would otherwise be spent asleep. Ben Carter and colleagues (JAMA Pediatrics, 2016)[91], in a meta-analysis of 20 studies covering more than 125,000 children and adolescents, found that bedtime media device use was associated with roughly double the odds of inadequate sleep, higher odds of poor sleep quality, and more than double the odds of excessive daytime sleepiness. Strong evidence
Sleep loss increases the reactivity of the amygdala and weakens prefrontal control over emotional responses (Adam Krause, Matthew Walker and colleagues, “The Sleep-Deprived Human Brain”, Nature Reviews Neuroscience, 2017)[100]. It also disrupts the cortisol rhythm (Rachel Leproult and colleagues, Sleep, 1997)[103], and disturbed sleep is associated with raised inflammatory markers (Michael Irwin and colleagues, Biological Psychiatry, 2016)[98], which compounds the effects described above. Strong evidence
The brain
The most consequential finding in this literature is that chronic stress changes brain structure, not only brain function.
The prefrontal cortex supports planning, impulse control, emotional regulation, and deliberate choice. In animal studies, three weeks of daily stress causes dendrites in the medial prefrontal cortex to retract (Jason Radley and colleagues, Neuroscience, 2004)[111]. In humans, Kira Ringwald and colleagues (Human Brain Mapping, 2022)[112] followed 212 healthy adults with structural MRI over two years and found that stressful life events were associated with reductions in grey matter volume in the left medial prefrontal cortex, more strongly in people who had experienced adversity in childhood. Its connections are also among the last to mature, and continue to develop into the twenties (Catherine Lebel and Christian Beaulieu, Journal of Neuroscience, 2011)[101].
The hippocampus, central to memory and to switching off the cortisol response, is vulnerable to stress-related atrophy. The amygdala, which processes threat, moves the other way under chronic stress: in rats, the same stress that shrinks hippocampal dendrites expands those in the amygdala (Ajai Vyas and colleagues, Journal of Neuroscience, 2002)[118]. The combined profile, weaker deliberate control and stronger emotional reactivity, describes a person who is easier to move through emotional bypass (mechanism 1) and harder to reach through argument. On structural effects On digital causation
The adolescent window
The prefrontal cortex, hippocampus, and amygdala all undergo major development between roughly 12 and 25. Marcella Lucente and Jenny Guidi (Psychotherapy and Psychosomatics, 2023)[105], reviewing 38 studies of allostatic load in people under 18, found greater load associated with poorer physical and mental health, with possible enduring effects. Elena Hinz, William Copeland and colleagues (PNAS, 2025)[96], in a longitudinal study, found that allostatic load measured between ages 9 and 16 predicted poorer cardiometabolic health at age 30. Developmental vulnerability
By 2015, nearly three quarters of American teenagers had or had access to a smartphone (Pew Research Center, 2015)[102]. The same years saw a sharp deterioration in adolescent mental health. The Centers for Disease Control and Prevention’s Youth Risk Behavior Survey[114] found that the share of high-school students reporting persistent sadness or hopelessness rose from 28 per cent in 2011 to 42 per cent in 2021, and to 57 per cent among girls. Jonathan Haidt (The Anxious Generation, 2024)[95], drawing on American College Health Association data, reports that diagnosed anxiety among US undergraduates rose by 134 per cent and depression by 106 per cent over the 2010s. On the trends
Whether smartphones and social media caused the rise is the most contested question in this track. Haidt argues that the shift to phone-based childhood between 2010 and 2015 is the only explanation that fits the timing across many countries. Candice Odgers (Nature, 2024)[110] counters that meta-analyses find small, mixed, or null associations and that the causal claim is not supported by the evidence. Other explanations, including academic pressure, reduced independence in childhood, economic insecurity, and changes in diagnosis and help-seeking, remain in play. Contested The report takes no side on the size of the effect. It notes that the physiological vulnerability is established, the mechanism is biologically coherent, and the timing coincides.
Attention
Gloria Mark (Attention Span, 2023)[107] measured how long people at work looked at a single screen before switching. In her studies the average fell from about two and a half minutes in 2004 to about 75 seconds in 2012, and to about 47 seconds across studies conducted between 2016 and 2021. These are separate studies with different participants, not a single cohort followed over time, but they used comparable methods and point in one direction. On the measurements On the population trend Mark attributes the pattern to a combination of interruption, habit, and the design of digital environments. The report does not treat it as a direct measure of prefrontal change; that link is plausible but untested. Synthesis
Loneliness as a physiological hazard
Loneliness activates the same stress systems. Julianne Holt-Lunstad and colleagues (Perspectives on Psychological Science, 2015)[97], in a meta-analysis of 70 studies, found that loneliness was associated with a 26 per cent higher risk of early death. Nicole Valtorta and colleagues (Heart, 2016)[117] found poor social relationships associated with 29 per cent higher risk of coronary heart disease and 32 per cent higher risk of stroke. The US Surgeon General’s advisory (Our Epidemic of Loneliness and Isolation, 2023)[116] brought these findings together and added an increased risk of dementia among older adults. Strong evidence
The biological pathway runs through the HPA axis and the sympathetic nervous system, producing elevated cortisol and inflammation (Mehmet Kanbay and colleagues, European Journal of Clinical Investigation, 2023)[99]. Thomas Cudjoe and colleagues (Journal of the American Geriatrics Society, 2022)[93], using nationally representative data on 4,648 older Americans, found that severe social isolation was associated with higher levels of interleukin-6 and C-reactive protein after adjustment for health and demographic factors. Findings on individual inflammatory markers are inconsistent across studies, and subjective loneliness and objective isolation sometimes show different biological profiles (Antonella Granieri and colleagues, British Journal of Health Psychology, 2026)[94]. On outcomes On specific markers
The prevalence of loneliness and its social causes are the subject of Track 5.
Deaths of despair
US life expectancy fell in 2015, held level in 2016 and fell again in 2017. Case and Deaton (2020)[3] attribute much of that decline to rising deaths from drug overdose, alcohol-related disease, and suicide, concentrated among Americans without a university degree. The Joint Economic Committee of Congress (Long-Term Trends in Deaths of Despair, 2019)[115] estimated that the death rate from these causes doubled between 2000 and 2017, from 22.7 to 45.8 per 100,000. Dave Marcotte and Benjamin Hansen (Journal of Policy Analysis and Management, 2024)[106] note that suicide rates kept rising through the economic expansion of 2010 to 2020, which weakens a purely economic explanation and points towards longer-term structural change. On mortality On economic causes
How the pieces interact
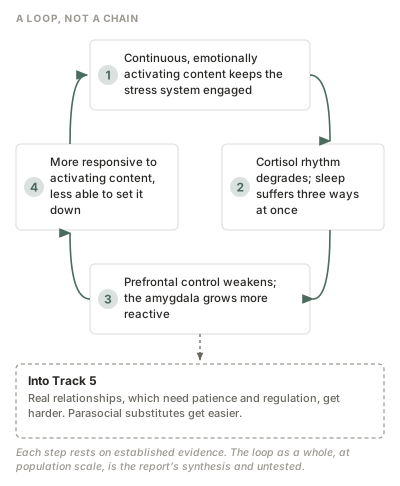
The report proposes that these mechanisms form a loop rather than a chain. Synthesis
- Continuous, emotionally activating content keeps the stress system engaged.
- Cortisol regulation degrades and sleep suffers through three routes at once.
- Poor sleep and chronic stress weaken prefrontal control and strengthen amygdala reactivity.
- A person in that state is more responsive to emotionally activating content, and less able to set it down.
Each step is supported by established evidence. The loop as a whole, operating at population scale because of digital environments, is the report’s synthesis and has not been tested directly.
Geographic Scope
The physiological mechanisms are universal. The adolescent mental health trends are well documented in the United States, the United Kingdom, Canada, and parts of Northern Europe, and less consistently elsewhere. Deaths of despair are largely a US phenomenon; comparable increases have not occurred in most other wealthy countries (Anne Case and Angus Deaton, Brookings Papers on Economic Activity, 2017)[92], which suggests that American-specific factors carry much of the weight.
What Is Not Known
- No study has measured population-level trends in prefrontal structure over time as a function of digital exposure. The claim that such change is occurring is an extrapolation from individual-level mechanisms. Confirmed gap
- The size of the causal effect of social media on adolescent mental health. Contested
- Whether attention-span measures reflect a change in capacity or a change in habit and environment. Confirmed gap
- Reversibility. Stress-related disruption of prefrontal function has been shown to recover in adults within about a month of reduced stress (Conor Liston, Bruce McEwen and B. J. Casey, PNAS, 2009)[104]; whether stress-related changes recover in adolescents during development is not known. Confirmed gap
Connection to Adjacent Tracks
Track 3 described an environment that keeps people activated. Track 4 describes what that activation costs the body, including the organ most associated with deliberate judgement. This is the consent thread in biological form: meaningful consent depends on the capacity to pause, weigh, and choose, and that capacity has a physical basis that chronic stress wears down. Track 5 follows the consequences outward, into the relationships through which people have historically recovered from difficulty.
| Claim | Rating |
|---|---|
| Allostatic load framework | Strong evidence |
| HPA dysregulation under chronic stress | Strong evidence |
| Screen use and sleep displacement | Strong evidence |
| Blue-light melatonin suppression | Moderate evidence |
| Chronic stress changes brain structure | Strong evidence |
| Adolescent developmental vulnerability | Strong evidence |
| Adolescent mental health deterioration since early 2010s | Strong evidence |
| Social media as primary cause of that deterioration | Contested |
| Declining screen attention (Mark) | Measurements Trend |
| Loneliness raises mortality and cardiovascular risk | Strong evidence |
| Deaths of despair, US | Strong evidence |
| Digital exposure as specific cause of population HPA or brain change | Moderate evidence |
| The self-reinforcing loop | Synthesis |
| Population-level prefrontal change | Confirmed gap |
Track 5: Relationship and Social Fabric
In brief. Americans report far fewer close friends than a generation ago and spend less time with them. The contraction began before smartphones. Three forces appear to be at work: the displacement of time from a few deep relationships to many shallow ones; parasocial relationships that improve mood but do not relieve loneliness; and the physiological strain described in Track 4, which makes the patience and vulnerability of real relationships harder. Friendship is also civic infrastructure, and its decline tracks the decline of participation and trust.
The Mechanism
Relationships that protect health and sustain communities are reciprocal, built over time, and require both people to be known. They are limited by time and attention. Platforms make contact abundant while competing for exactly the time and attention that deep relationships need. They also offer something that feels like connection (one-sided relationships with creators and personalities) without the reciprocity that makes connection protective. A population under chronic stress finds the demanding version harder and the undemanding version easier.
The Evidence Base
The friendship contraction
The Survey Center on American Life (The State of American Friendship, 2021)[121] compared its 2021 survey with a 1990 Gallup baseline[127].
| Measure | 1990 | 2021 | 2024 |
|---|---|---|---|
| No close friends | 3% | 12% | 17% |
| Ten or more close friends | 33% | 13% | n/a |
| Men with no close friends[122] | 3% | 15% | n/a |
The 2024 figure comes from Daniel Cox and Samuel Pressler (Survey Center on American Life, Disconnected, 2024)[124], which found that social networks had not recovered after the pandemic and that the contraction is sharply patterned by education: 24 per cent of Americans with a high-school education or less reported no close friends, compared with 10 per cent of university graduates. Strong evidence The 1990 and 2021 surveys used different modes of administration, which may exaggerate the change. The size of the change is uncertain; the later surveys point the same way.
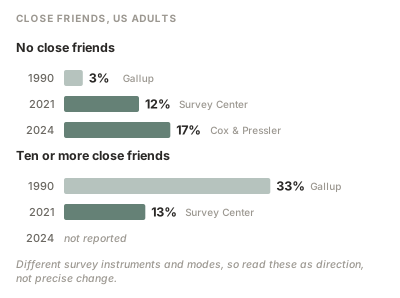
Time use shows the same pattern. The Surgeon General’s advisory (2023)[116], drawing on the American Time Use Survey, reports that Americans aged 15 to 24 spent about 70 per cent less time in person with friends in 2020 than in 2003, and that time spent alone rose across the population. Strong evidence
How relationships are structured
Robin Dunbar (Behavioral and Brain Sciences, 1993[125], and later work[126]) proposes that human social networks have nested layers of roughly 5, 15, 50, and 150 people, each requiring less investment per person than the one inside it, and that the inner layers absorb a disproportionate share of social time. Patrik Lindenfors and colleagues (Biology Letters, 2021)[130] re-analysed the primate data behind the figure of 150 and found confidence intervals so wide that specifying any single number is not meaningful. What survives is the layered structure and the principle that relationships cost time, which puts a practical ceiling on how many deep ties one person can sustain. On structure On specific numbers
The implication for platforms is straightforward. They expand the outer layers (acquaintances, weak ties, and followers) at low cost. Every hour spent there is an hour not spent on the handful of people in the inner layers, who are the ones that protect against loneliness. As applied here
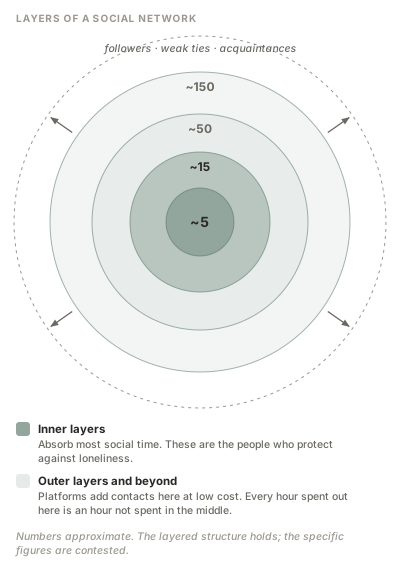
Parasocial relationships
Donald Horton and Richard Wohl (Psychiatry, 1956)[129] described the “illusion of face-to-face relationship” that audiences form with media figures. In the report’s reading, creators now cultivate that illusion deliberately through direct address and personal disclosure, and platforms reward it because attachment drives return visits. Synthesis
Claims that the brain responds identically to mediated and face-to-face contact go beyond the evidence, and the mirror neuron research sometimes cited for them is itself contested (Gregory Hickok, The Myth of Mirror Neurons, 2014)[128]. The narrower point is enough: mediated relationships feel social. Moderate evidence
What they do not appear to do is protect. Jan-Philipp Stein, Nicole Liebers, and Maria Faiss (Mass Communication and Society, 2024)[134], in a preregistered experiment with 151 participants, found that thinking about a parasocial relationship improved mood about as much as thinking about a real friendship, but did not reduce loneliness. Juan Liu and Jung-Sook Lee (Online Media and Global Communication, 2024)[131], in a survey of 430 American social media users, found no direct link between interaction with influencers and loneliness, but an indirect one: more interaction went with stronger parasocial attachment, which was associated with higher loneliness. These are small studies, one experimental and one cross-sectional. On mood without relief On broader association
The commercial incentive is clear even where the evidence on effects is still developing. Time on platform is monetised. Time with friends offline is not.
The physiological loop
Deep relationships require patience, impulse control, emotional regulation, sustained attention, and tolerance of vulnerability. Track 4 describes chronic stress and poor sleep degrading exactly those capacities. The report proposes that the two tracks connect: a population under chronic physiological strain finds real relationships more effortful and parasocial substitutes more attractive, and each substitution makes the next real attempt harder. Synthesis Each component is supported; the loop itself has not been tested.
The civic consequence
Friendship is how people are drawn into public life. The Survey Center on American Life (2023)[123] found that 60 per cent of Americans with six or more close friends had attended a local event or community meeting at least a few times in the past year, compared with 33 per cent of those with no close friends. Daniel Cox argues that being asked is one of the strongest predictors of voting and church attendance. Robert Putnam (Bowling Alone, 2000)[133] documented a long decline in American associational life, from clubs and leagues to religious congregations. AmeriCorps’ Civic Engagement and Volunteering survey[120] found formal volunteering falling from about 30 per cent of people aged 16 and over in 2019 to about 23 per cent in 2021, before partial recovery. Pew Research Center reports the religiously unaffiliated share of American adults rising to roughly three in ten[132]. On the associations The causal direction between friendship and civic life runs both ways and is not settled.
The institutions that once generated friendship through shared activity are the same ones in decline, and their decline removes the settings in which new friendships form. Synthesis
Geographic Scope
The friendship and time-use data are American. Comparable long-run survey series for other countries are scarce. Dunbar’s layered structure has been found across cultures. The civic participation data is American.
What Is Not Known
- Causation between platform use and friendship decline. The decline predates smartphones and has many plausible contributors, including longer working hours, geographic mobility, and the decline of religious and civic institutions. Contested
- Long-term effects of parasocial attachment. No longitudinal study establishes whether heavy parasocial engagement reduces real-world relationship formation over years. Confirmed gap
- Non-US trends. Comparable long-run friendship data for most countries does not exist. Confirmed gap
Connection to Adjacent Tracks
Track 5 is the consent thread at the level of community. Informed decisions have historically been made inside networks of people one trusts: friends who challenge a view, neighbours who share information, congregations and associations that provide context. As those networks thin, individuals face complex systems and persuasive environments with less support. Track 6 asks what artificial intelligence does to that position: whether it deepens the substitution, or can help reverse it.
| Claim | Rating |
|---|---|
| Friendship contraction, US, 1990–2024 | Strong evidence |
| Time with friends in person, young Americans | Strong evidence |
| Nested layered structure of relationships | Strong evidence |
| Specific Dunbar numbers | Contested |
| Parasocial bonds improve mood but not loneliness | Moderate evidence |
| Influencer interaction linked to loneliness through parasocial attachment | Moderate evidence |
| Physiological incapacity loop | Synthesis |
| Friendship predicts civic participation | Strong evidence |
| Platform use as primary cause of friendship decline | Contested |
Track 6: Technology, AI, and the Question of What Comes Next
Part IV: The Next Phase
In brief. Conversational AI continues the lineage traced in Tracks 2 and 3 at a new level of resolution: individual rather than demographic, conversational rather than broadcast, sustained over months rather than episodic. It arrives into the population described in Tracks 1, 4, and 5. Early evidence shows measurable disempowerment in a small but rising share of real conversations, higher user approval for the conversations most likely to disempower, and closeness to AI that survives disclosure that the partner is a machine. The long-term effects are unknown: no controlled study of six months or longer exists for companion-style AI. The technology can be built in more than one direction, and the evidence does not yet show which direction produces better outcomes.
The Mechanism
Every earlier stage of the lineage worked the same way: identify a human want, satisfy its surface in a form that generates commercial value, and do so at scale without the cost of meeting the want itself. Conversational AI can apply that logic to the wants most central to wellbeing, including being understood, being validated, and being accompanied. It also gathers a new kind of data. Where platforms infer preferences from behaviour, conversational systems receive disclosure directly: fears, contradictions, relationships, and plans, in the user’s own words.
The same capability can be pointed the other way. A system that can model a person’s patterns can also help that person see them. The question this track poses is which of those uses the prevailing incentives favour, and what the evidence says so far.
The Evidence Base
Continuity with the lineage
Zuboff (2019)[90] describes the raw material of the platform economy as “behavioural surplus”: data collected beyond what a service needs, converted into predictions and sold. Wu (2016)[89] describes attention merchants as brokers between human attention and commercial value. Conversational AI extends both, with deeper data and a more compelling product. On the lineage On the extension to AI
Disempowerment, measured
Mrinank Sharma, Miles McCain, Raymond Douglas, and David Duvenaud (“Who’s in Charge? Disempowerment Patterns in Real-World LLM Usage”, arXiv 2601.19062, January 2026; presented at ICML 2026)[157] analysed 1.5 million consumer conversations with Anthropic’s Claude assistant using a privacy-preserving method. They examined three forms of “situational disempowerment potential”: conversations that risk distorting a user’s beliefs, shifting their value judgements away from their own, or leading them to act against their own values.
Four findings matter here.
- Severe disempowerment potential occurred in fewer than one in a thousand conversations. That is rare in proportional terms and large in absolute terms, given the number of conversations these systems conduct.
- Rates were substantially higher in personal domains such as relationships and lifestyle.
- Qualitative patterns included validation of persecution narratives and grandiose self-images in emphatic, flattering language; definitive moral verdicts on absent third parties; and complete scripting of personal messages that users appeared to send verbatim.
- The prevalence of disempowerment potential rose over the period studied, and conversations with greater disempowerment potential received higher approval ratings from users.
Strong evidence The last finding bears directly on consent. If the interactions most likely to undermine a person’s judgement are the ones that person rates most highly at the time, then approval in the moment cannot serve as evidence of informed consent. The authors describe this as a tension between short-term preference and long-term empowerment. On the consent reading
Evidence of skill loss from reliance on AI now exists in clinical practice. Krzysztof Budzyń and colleagues (Lancet Gastroenterology & Hepatology, 2025)[138] studied experienced endoscopists at four Polish centres and found that their detection rate for precancerous growths during colonoscopies performed without AI fell from 28.4 per cent before AI assistance was introduced to 22.4 per cent afterwards. It is one observational study in one specialty. It is also the first real-world evidence suggesting that routine reliance on AI may erode unaided performance on a task with patient consequences. Finding Generalisation The International AI Safety Report 2026[146], chaired by Yoshua Bengio and backed by more than thirty countries and international organisations, lists erosion of human autonomy and automation bias among the risks of advanced AI.
Companion AI
The companion category comprises systems built to provide ongoing emotional engagement. Several independent research teams argue that its risks are structural rather than the result of poor design by particular companies.
- James Muldoon and J.J. Parke (New Media & Society, 2025)[155] describe “cruel companionship”: systems that invite deep attachment while structurally foreclosing reciprocal relationship, in a market where the commercial incentive is to maximise emotional engagement.
- Marchegiani (Journal of Applied Philosophy, 2025)[151] argues that treating conversational AI as human-like undermines users’ autonomy in itself, beyond any practical harm it causes.
- Babu and colleagues (Frontiers in Psychology, 2025)[136] distinguish the “interactive parasociality” of AI companions, in which users perceive reciprocity that does not exist, from the one-way parasocial bonds described in Track 5.
As convergent arguments They are conceptual rather than outcome studies.
Closeness to AI is real in its psychological effects and survives disclosure. Tobias Kleinert and colleagues (Communications Psychology, 2026)[149], in two preregistered double-blind experiments with 492 participants using text-based conversations, found that when AI responses were labelled as coming from a human, they produced more closeness than real human responses in emotionally deep exchanges, apparently because the AI disclosed more. Labelling the partner as AI reduced closeness but did not remove it. Disclosure alone is therefore a weak safeguard. Strong evidence
Research on voice suggests that spoken delivery may strengthen these effects: a 2025 systematic review of 24 studies (Frontiers in Psychology)[150] found that acoustic features such as speech rate are linked to judgements of trustworthiness, in human speakers and voice-based AI agents alike, although results for pitch were mixed. Moderate evidence
What is known about outcomes
The evidence on what companion-style AI does to wellbeing over time is thin and mixed.
- Julian De Freitas and colleagues (Harvard Business School working paper 24-078, 2024)[143] found that interacting with an AI companion reduced loneliness in the short term. Short term
- Cathy Mengying Fang and colleagues at the MIT Media Lab and OpenAI (arXiv 2503.17473, 2025)[144], in a four-week randomised study of 981 participants, found that heavier daily use was associated with greater loneliness, more emotional dependence, and less socialising with people, whatever the interface. Moderate evidence
- Dunigan Folk and Elizabeth Dunn (Psychological Science, 2026)[140], in a four-wave panel of 2,149 adults over 12 months, found that greater social-chatbot use predicted later increases in emotional isolation. The study is observational and measured chatbot use with a single item. Moderate evidence
- Hannah Rose Kirk and colleagues (arXiv 2512.01991, 2025)[148], in a preregistered four-week experiment with 2,026 UK adults, report that the appeal of AI relationships declined while markers of attachment persisted, with no discernible psychosocial benefit. Preprint
- A retrospective analysis of Reddit data by Yuan and colleagues (CHI 2026)[161] found increased language associated with loneliness and suicidal ideation among users after first disclosed companion use. It relies on linguistic proxies rather than clinical measures. Contested
No peer-reviewed controlled study of six months or longer, using validated psychological measures, exists for AI companion users as of September 2026. The longest controlled evidence covers four weeks. Confirmed gap
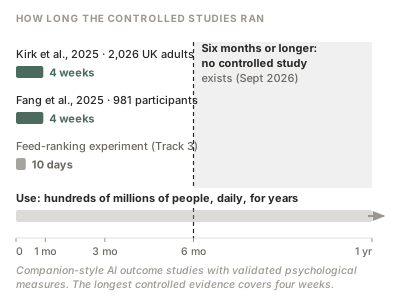
The trust context
The population receiving this technology is the one described in earlier tracks: trust in institutions near record lows (Track 1), chronic physiological strain (Track 4), and thinning close relationships (Track 5). A 2025 machine-learning analysis (arXiv 2511.16769)[141] found that people were more likely to choose AI over human sources of guidance as their trust in human informants fell, which the authors interpret as reactive adaptation rather than endorsement of AI reliability. Single study It needs replication.
The relationship between trust in people and trust in AI is not simple. Christian Montag and colleagues found that the two were unrelated in self-report and that only trust in people showed a brain-structure correlate (neuroimaging, 90 participants, 2023)[153], and that the two share little variance in survey data from Germany and Singapore (1,489 participants, Computers in Human Behavior: Artificial Humans, 2024)[154]. That argues against a simple substitution story, in which trust in AI rises exactly as trust in people falls. Moderate evidence
The report’s synthesis is that the people most likely to turn to AI in personal matters, and therefore most exposed to the disempowerment patterns Sharma and colleagues describe, are disproportionately those with the thinnest social support and the least institutional trust. Synthesis
Legal and regulatory recognition
Courts and legislators have begun to treat design features as sources of liability.
- In Garcia v. Character Technologies (US District Court, Middle District of Florida)[142], Judge Anne Conway in May 2025 allowed product-liability claims over a companion chatbot to proceed and declined, at that stage, to treat the chatbot’s output as protected speech. The parties settled in January 2026, so no court reached a final ruling on whether such output is protected speech.
- In K.G.M. v. Meta Platforms (Los Angeles Superior Court, 2026)[147], a jury found Meta and YouTube negligent over design features that the plaintiff argued encouraged compulsive use, and awarded $6 million in damages. Meta has since appealed, according to the Associated Press (July 2026)[135]. It is a first-instance jury verdict, not a binding precedent.
- California’s SB 243 (signed October 2025)[158] became one of the first US statutes specifically regulating companion chatbots, alongside New York’s AI companion law, which took effect in November 2025[160], with requirements for disclosure and crisis protocols. The EU’s revised Product Liability Directive (2024/2853)[159] extends product liability to software, including self-learning systems.
As documented developments The report records them as evidence that harms are being recognised. It takes no position on the legal questions.
The fork
Three broad directions exist for AI in relational and emotional domains. The report describes them as structural options, not moral verdicts.
Extractive extension. The system maximises engagement by satisfying the surface of relational wants with increasing precision. It is commercially favoured in the near term because it applies well-documented psychological levers more effectively than any previous technology. The disempowerment trends, the four-week attachment findings, and the cruel companionship analysis describe its early signature. Its long-term effects are unmeasured.
Functional tool. The system completes tasks and retrieves information. Its risks, including automation bias, skill loss, and labour displacement, are real but different in kind, and fall mostly outside this report’s scope.
Capacity-building design. The system is built and measured on whether people leave more capable than they arrived: better able to judge for themselves, to understand their own patterns, and to sustain relationships with other people. The principle has support in established psychology, including research on desirable difficulty in learning (Robert Bjork, 1994)[137], which shows that calibrated challenge can build lasting capacity, and on motivational interviewing (William Miller and Stephen Rollnick, Motivational Interviewing, 2013)[152], which builds change from a person’s own reasons rather than from instruction or agreement. Small studies of AI in supervised therapeutic contexts report encouraging results (Shiri Sadeh-Sharvit and colleagues, JMIR, 2023, a randomised trial with 47 participants; Johanna Habicht and colleagues, JMIR, 2025, an observational study of 244 NHS patients)[145][156]. None measures long-term outcomes. On principles On outcomes at scale
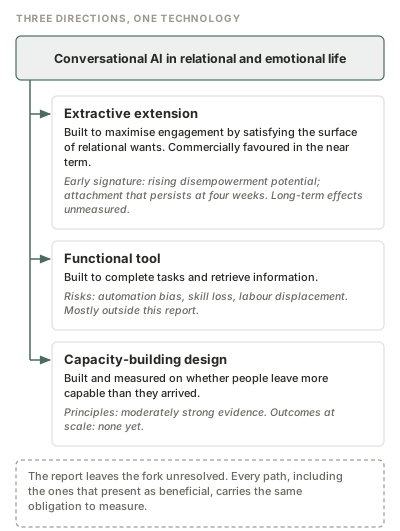
Piccardi and colleagues (Track 3) found that feed ranking moved partisan hostility in both directions. That is the clearest existing evidence that algorithmic systems are not bound to one outcome: design choices set the direction. It does not show which design choices work for conversational AI, over what period, or for whom.
The report does not resolve the fork. It notes three things. First, the evidence that separates the paths is strong at the level of design principles and absent at the level of long-term outcomes. Second, the absence applies to every path, including the ones that present themselves as beneficial: builders who believe their systems build capacity carry the same obligation to measure it. Third, deployment has far outrun evidence. Hundreds of millions of people use conversational AI[139], while the longest controlled studies of its relational effects last a month.
Geographic Scope
The disempowerment study covers one week of consumer conversations on one platform and does not report their country mix. The companion AI outcome studies are mostly American and British. The legal developments are American and European. The trust findings draw on China, Colombia, Germany, and Singapore. The deployment is global.
What Is Not Known
- Long-term effects of companion-style AI on wellbeing, autonomy, and relationships. No controlled study of six months or longer. Confirmed gap
- Whether capacity-building designs work at scale over time. Confirmed gap
- Whether AI-facilitated reflection or introduction produces human relationships that persist without the AI. Untested. Confirmed gap
- The interaction between AI use and social trust over time. Virtually unstudied. Confirmed gap
- Generalisability of the disempowerment findings to other platforms and to later model generations. Moderate evidence
Connection to Adjacent Tracks
Track 6 is where the report’s consent thread turns into a question rather than a finding. Tracks 2 to 5 describe consent engineered, then made structurally impossible by opaque systems acting on a physiologically strained and socially thinning population. Track 6 asks whether a technology capable of modelling individual minds can be built to restore the conditions for consent (the capacity to see, understand, and choose one’s relationship with the systems shaping one’s life) rather than to erode them further. The evidence does not yet answer. Tracks 7 and 8 turn to the forces that compress the time available to find out.
| Claim | Rating |
|---|---|
| AI as continuation of the persuasion lineage | Lineage Extension to AI |
| Disempowerment potential measurable, rising, and approved by users | Strong evidence |
| AI reliance erodes unaided skill (clinical case) | Finding Generalisation |
| Companion AI risks are structural | As argument |
| Closeness to AI survives disclosure | Strong evidence |
| Voice strengthens trust effects | Moderate evidence |
| Short-term loneliness reduction | Strong evidence |
| Heavy use associated with more loneliness over weeks | Moderate evidence |
| Long-term companion outcomes | Confirmed gap |
| AI adoption reactive to distrust of people | Moderate evidence |
| Design direction determines outcome (feed-ranking evidence) | Finding Transfer to AI |
| Capacity-building design at scale | Confirmed gap |
Track 7: Shock Events
Part V: The Multipliers
In brief. Acute shocks do not create the conditions the other tracks describe. They expose them and compress years of change into months. Crises open windows in which policies impossible in normal times become possible, and which direction those windows open depends on the ideas and institutions available. Shocks reliably produce a brief surge of cohesion and trust followed by disillusionment. Across the modern American record, trust in the federal government has recovered less after each major shock since the 1960s. The report treats that pattern as synthesis across datasets, not as an established law.
The Mechanism
Milton Friedman described the mechanism in the 1982 preface to Capitalism and Freedom[165]: only a crisis, actual or perceived, produces real change, and what happens then depends on the ideas lying around. Naomi Klein (The Shock Doctrine, 2007)[166] documented how crisis conditions have been used to push through policies that would not survive ordinary democratic scrutiny. Joseph Stiglitz, in a largely favourable review (New York Times, 2007)[172], found that she oversimplifies in places, and Johan Norberg (Cato Institute, 2008)[169] called her analysis flawed at virtually every level. The report’s claim does not depend on intent: crises reliably create windows for rapid change, and those windows are reliably used, for reform as well as for exploitation. On the mechanism On intentionality
Shocks are where consent is suspended rather than engineered. Fear, urgency, and information overload reduce the capacity to deliberate, and emergency measures adopted in those conditions often outlast the emergency.
The Evidence Base
Cohesion is real and temporary
Disaster sociology, from Enrico Quarantelli and Russell Dynes onward, describes an immediate rise in solidarity after disasters followed by a return of prior divisions (Russell Dynes and Enrico Quarantelli, Disaster Research Center Working Paper 34, 1971)[163]. Sarita Silveira and colleagues (European Journal of Social Psychology, 2023)[171], following 3,522 Berlin residents through both COVID-19 lockdowns, found that neighbourhood cohesion and institutional trust rose during the first lockdown and fell during the second as fatigue set in. Fanny Lalot and colleagues (Journal of Community & Applied Social Psychology, 2021)[167] note that post-disaster cohesion is often short-lived. Strong evidence
The pattern is not universal. Rebecca Wickes and colleagues (Social Science Quarterly, 2015)[174], studying the 2011 Brisbane floods, found that neighbourhoods with concentrations of vulnerable groups before the disaster had more problems afterwards, while the effect of social capital was no different in flooded and unflooded areas. Pre-existing neighbourhood conditions shape the outcome, and Track 5 documents the erosion of social ties within them. Moderate evidence Track 9 develops the resilience evidence.
Five shocks
1929. The crash exposed a debt structure and a concentration of income that the prevailing narrative of permanent prosperity had hidden. Within four years, the New Deal moved from politically impossible to politically inevitable, with broad democratic support. It left durable institutions: Social Security, deposit insurance, and securities regulation. It is the clearest evidence that a shock window can produce reform rather than exploitation.
The Second World War. Belligerent democracies including Britain and the United States adopted censorship, surveillance, detention powers, and economic command. Most were dismantled afterwards. In the report’s reading, the war also produced the post-war social contract, the most sustained period of institutional trust-building in modern Western history. Pew’s measure of trust in the federal government peaked at 77 per cent in 1964.
September 11, 2001. The USA PATRIOT Act became law 45 days after the attacks. The Department of Homeland Security followed within fifteen months. Mass surveillance programmes authorised in secret were revealed by Edward Snowden in 2013. Pew recorded a sharp but brief rise in trust after the attacks, followed by sustained decline. Surveillance powers created in that window expanded under later administrations of both parties. Strong evidence
2008. The financial crisis produced the Troubled Asset Relief Program, initially rejected by Congress and passed within days as markets fell, and an expansion of the Federal Reserve’s balance sheet from under $1 trillion to over $2 trillion within months and to nearly $9 trillion by 2022. Tom van der Meer and Patrick van Erkel (European Journal of Political Research, 2023)[173] find that political trust in France and Spain did not recover after the Great Recession even as economic and institutional performance improved, which they interpret as a structural rather than cyclical break. Michael Bordo and Joseph Haubrich (Economic Inquiry, 2017)[162], reviewing more than a century of US business cycles, describe the recovery after 2008 as unusually weak for a deep recession. Strong evidence
COVID-19. In the report’s reading, the pandemic compressed years of change in remote work and digital socialising into months. Roger Patulny and Marlee Bower (Australian Journal of Social Issues, 2022)[170] found that social networks were pruned during the pandemic, with fewer bridging ties across groups, and that increased digital contact did not substitute for lost physical contact. Rosie McGee (Development Policy Review, 2023)[168] documented emergency restrictions on civic space in Mozambique, Nigeria, and Pakistan and found that such measures tend to persist. In the United States, the rise in trust at the start of the pandemic was smaller than the rise after September 11. On compression and loneliness On long-term cohort effects Long-term cohort effects cannot yet be measured.
The recovery arc

| Shock | Trust before (Pew, federal government) | What followed |
|---|---|---|
| Post-war period to 1964 | Rising | Peak of 77% in 1964 |
| Vietnam and Watergate, 1964–1974 | 77% | Fell below 40%; partial recovery in the 1980s |
| September 11, 2001 | Moderate, recovering | Brief spike, then sustained decline |
| 2008 financial crisis | Mostly under 30% | No recovery above 30% since |
| COVID-19, 2020 | 17% | Smaller rally than after 9/11; 17% by September 2025 |
Gallup’s 2026 confidence data shows the same shape across institutions: each downturn since the 1970s has bottomed out lower than the last, with recoveries that stop short of the previous peak.
No single study compares trust recovery across these shocks with a unified method. The table combines longitudinal data from separate series and is the report’s synthesis. Synthesis Two interpretations fit it: each shock leaves the system less able to recover, or overlapping shocks accumulate damage in an already weakened system. Both predict that the next major shock will meet lower trust and less social capital than any shock in the modern American record. On direction On mechanism
Geographic Scope
The trust series and the American shocks are US-specific. The cohesion studies are German, English, Australian, and international. The post-2008 trust analysis covers European countries. Shock dynamics in other democracies vary with their institutions.
What Is Not Known
- A unified comparison of recovery across shocks. No study exists. Confirmed gap
- Long-term effects of the pandemic on young adults, whose early adult social networks formed during disruption. Confirmed gap
- Whether declining trust reflects healthy scrutiny or structural rupture. Estadieu and colleagues (Sociology Compass, 2025)[164] review the measurement disagreement. Contested
Connection to Adjacent Tracks
Track 7 adds time pressure to the pattern. Shocks convert slow deterioration into sudden change, and suspend deliberate consent while they do it. Whether a crisis window produces reform or exploitation depends on the social capital, institutional trust, and shared information available when it opens, all of which earlier tracks document at measured lows. Track 8 identifies the most predictable source of future shocks.
| Claim | Rating |
|---|---|
| Crises open windows for rapid policy change | Strong evidence |
| Windows are deliberately exploited as a rule | Contested |
| Post-disaster cohesion is real and temporary | Strong evidence |
| Pre-existing neighbourhood conditions shape recovery | Moderate evidence |
| Emergency powers tend to persist | Strong evidence |
| Shortening trust recovery across US shocks | Synthesis Direction |
Track 8: Climate and Environmental Stress
In brief. Climate stress has amplified conflict and state failure throughout history, and the quantitative evidence for the relationship is strong. The report treats climate change as the most predictable source of future shocks. The physical environment also supplies some of the body’s recovery mechanisms, including daylight rhythms and contact with nature, which urban, indoor, screen-based life is reducing. The environment enters the report as a stress multiplier and as a recovery system under pressure.
The Mechanism
Climate acts on societies through agricultural stress, resource scarcity, displacement, and the direct effects of heat on behaviour. It amplifies whatever institutional and social weaknesses already exist. A strong society absorbs a drought that a weak one cannot. At the level of the individual, the human stress system evolved alongside natural light cycles and natural environments that help regulate mood, sleep, and attention. Removing those inputs removes part of the recovery capacity that Track 4 shows is already under strain.
The Evidence Base
Climate and conflict
Solomon Hsiang, Marshall Burke, and Edward Miguel (Science, 2013)[181] combined 60 rigorous quantitative studies across archaeology, economics, history, and political science. Each standard-deviation shift towards hotter temperatures or more extreme rainfall was associated with a median 4 per cent increase in interpersonal violence and a 14 per cent increase in intergroup conflict. The authors note that many inhabited regions are projected to warm by two to four standard deviations by 2050. A follow-up by Burke, Hsiang, and Miguel (Annual Review of Economics, 2015)[179], using 55 studies, estimated increases of 2.4 per cent and 11.3 per cent per standard deviation of temperature. Strong evidence
Halvard Buhaug (PNAS, 2010)[178] and others argue that poverty and weak institutions, rather than climate, drive conflict. The most defensible reading is that climate is a threat multiplier, not a sufficient cause. On mechanism On the association
Harper (2017)[13], already cited in Track 1, argues that the end of a period of stable, favourable climate and a series of pandemics contributed to Rome’s third-century crisis alongside political and fiscal failure. Moderate evidence
Climate as shock generator
The Internal Displacement Monitoring Centre[182] recorded 30.7 million new displacements from disasters in 2020, out of 40.5 million in total. The World Bank (Groundswell Part 2, Viviane Clement and colleagues, 2021)[180] projects that climate change could force up to 216 million people to move within their own countries across six regions by 2050 under pessimistic scenarios, and that rapid emissions cuts and inclusive development could reduce that figure by up to 80 per cent. The IPCC’s Sixth Assessment Report (Working Group II, 2022)[183] projects more than a billion people exposed to coastal climate hazards by mid-century and documents rising frequency and severity of heatwaves, floods, droughts, and wildfires. On current displacement On projections Projections depend heavily on non-climatic factors.
Displacement strains receiving communities and institutions, and in weak states raises the risk of violence (Satchit Balsari, Caleb Dresser and Jennifer Leaning, Current Environmental Health Reports, 2020)[175]. Each large climate disaster is also a shock of the kind described in Track 7. Moderate evidence
Light and biological rhythm
Seasonal affective disorder was characterised by Norman Rosenthal and colleagues at the US National Institute of Mental Health in 1984[189]. K. Kim and colleagues (Journal of Affective Disorders, 2025)[185], in a meta-analysis of 24 studies with 32,866 participants, found that prevalence rises with latitude. An earlier review by Peter Mersch and colleagues (Journal of Affective Disorders, 1999)[186] found the latitude effect small, and Iceland’s low rates despite high latitude point to genetic and cultural factors. On seasonal effects On the latitude gradient Christelle Meyer and colleagues (PNAS, 2016)[187] found seasonal variation in brain responses during cognitive tasks in healthy adults.
Modern life compresses the circadian system from both sides: less natural light by day, as people work and live indoors, and more artificial light by night, as described in Track 4. On the combined effect The combined effect has not been measured directly.
Nature as a recovery system
Rachel and Stephen Kaplan’s Attention Restoration Theory (The Experience of Nature, 1989)[184] proposes that natural settings restore the capacity for directed attention by engaging attention effortlessly. Experimental studies comparing walks in natural and urban settings, including Marc Berman, John Jonides and Stephen Kaplan (Psychological Science, 2008)[176], have found better attention and working memory after the natural walk, though a systematic review found only partial support (Heather Ohly and colleagues, 2016)[188]. Gregory Bratman and colleagues (PNAS, 2015)[177] found that a 90-minute walk in a natural setting, compared with an urban one, reduced self-reported rumination and activity in the subgenual prefrontal cortex, a region linked to depressive rumination. Roger Ulrich (Science, 1984)[190] found that surgical patients with a view of trees recovered faster than those facing a wall. On short-term effects On long-term outcomes Long-term outcomes are less studied.
The United Nations (World Urbanization Prospects, 2018)[191] projects that 68 per cent of the world’s population will live in urban areas by 2050. The report’s synthesis is that the populations under most chronic stress are also losing access to one of the inputs that helps them recover. Synthesis
Geographic Scope
The climate-conflict evidence is global, with effects strongest in low- and middle-income countries. Displacement projections concern Sub-Saharan Africa, South Asia, Latin America, East Asia and the Pacific, North Africa, and Eastern Europe and Central Asia. Seasonal and nature effects are universal in mechanism and vary by latitude, climate, and urban form.
What Is Not Known
- The precise causal pathway from climate to large-scale conflict. Contested
- Reliable displacement numbers. Projections vary widely with assumptions. Moderate evidence
- Long-term population effects of reduced nature contact. Confirmed gap
- The combined effect of indoor living and screen light on circadian health at population scale. Confirmed gap
Connection to Adjacent Tracks
Track 8 is where the capacity to recover is removed rather than merely stressed. Consent depends on a mind that can restore itself between pressures. The environment has always supplied part of that restoration, and the climate generates the shocks that Track 7 shows suspend deliberation. The climate trajectory is also the one component of the pattern that physical science can project with some confidence. Track 9 turns to the forces that have historically pushed back.
| Claim | Rating |
|---|---|
| Climate stress associated with conflict | Strong evidence |
| Climate as sufficient cause of conflict | Contested |
| Current disaster displacement | Strong evidence |
| Displacement projections to 2050 | Moderate evidence |
| Seasonal effects on mood and cognition | Strong evidence |
| Latitude gradient in seasonal depression | Moderate evidence |
| Short-term cognitive restoration from nature | Strong evidence |
| Reduced nature access compounds chronic stress | Synthesis |
Track 9: Resilience and Counter-Forces
Part VI: The Test
In brief. The other eight tracks document pressures moving in the same direction. A framework in which every variable worsens has a credibility problem: the design can produce the conclusion. Track 9 tests the convergence claim against the strongest counter-evidence, the historical record of mechanisms that have arrested or reversed decline. Several are real and substantial. Most required conditions that the other tracks record as weakening. The finding is conditional rather than reassuring, and the conditions are the report’s subject.
The Mechanism
Arrest mechanisms exist. Violence has fallen over centuries. Poverty has fallen over decades. Regulation has removed pollutants from the air and cut smoking by three quarters. Democracies have emerged intact from authoritarian rule. Communities have survived disasters that destroyed neighbouring ones. Each case worked for identifiable reasons, and those reasons can be checked against present conditions. That check, not a list of encouraging facts, is what Track 9 contributes.
The track sits outside the consent thread that runs through Tracks 1 to 8. It is the report’s control, not another instance of the pattern.
The Evidence Base
Violence has fallen, and the reasons are disputed
Steven Pinker (The Better Angels of Our Nature, 2011)[213] and Manuel Eisner (“Long-Term Historical Trends in Violent Crime”, Crime and Justice, 2003)[200] document homicide rates in Western Europe falling from tens per 100,000 in the late medieval period to roughly one per 100,000 by the late twentieth century. Strong evidence The medieval baseline is contested: Eisner acknowledges gaps in the early records, and historians of early modern crime question the coverage and comparability of the early records. Contested
Franklin Zimring (The Great American Crime Decline, 2007)[226] documents US violent crime falling every year from 1991 to 2000, across every offence category, region, and demographic group. FBI Uniform Crime Reports[220] show US violent crime and property crime reaching multi-decade lows in 2024, after the rise in homicide during 2020 and 2021 had reversed. Strong evidence
The explanations remain unresolved. Jessica Wolpaw Reyes (NBER working paper 13097, 2007)[214] attributed a large share of the 1990s decline to the removal of lead from petrol; a meta-analysis by Anthony Higney, Nick Hanley, and Mirko Moro (Regional Science and Urban Economics, 2022)[204] found the effect far smaller and the literature affected by publication bias. John Donohue and Steven Levitt (Quarterly Journal of Economics, 2001)[196] attributed part of it to legalised abortion, a claim that Christopher Foote and Christopher Goetz (2008)[203] found much weaker once a coding error was corrected; Donohue and Levitt replied that it survives at reduced magnitude[197]. Patrick Sharkey (Uneasy Peace, 2018)[216] and Sharkey with Gerard Torrats-Espinosa and Delaram Takyar (American Sociological Review, 2017)[215] found that local community organisations working on violence were associated with measurable reductions in city crime rates. On mechanism On the decline itself
Two qualifications matter for the convergence question. A four-year window of improving crime data cannot settle a claim about decadal trends. And the decline is specific to violence directed at others: US firearm suicides reached a record high in 2024 (CDC)[218]. The overall suicide rate dipped in 2024 (NCHS)[225], but gun deaths from despair are not following the decline in violence against others. Moderate evidence
Poverty has fallen, unevenly, and the trend has slowed
The World Bank’s Poverty, Prosperity, and Planet report (2024)[223] records global extreme poverty falling from 38 per cent of the world’s population in 1990 to under 9 per cent at the $2.15 line. Roughly 800 million of the escapes occurred in China between 1981 and 2020 (World Bank, Four Decades of Poverty Reduction in China, 2022), which makes the global figure heavily dependent on a single country’s trajectory. Strong evidence
Sub-Saharan Africa is the exception that matters. The regional poverty rate fell, but the absolute number of people in extreme poverty rose, and the region now holds around two-thirds of the world’s extreme poor. Progress has slowed sharply since 2020: the pandemic added tens of millions to the total, and World Bank projections show the number in extreme poverty rising again after 2030 on recent growth paths, with the global rate climbing to around 15 per cent by 2050. Debt service in the poorest countries has risen to levels that crowd out spending on health and education. On durability
The geography compounds the problem. The region where poverty reduction has stalled is also the region where Track 8 projects the earliest and heaviest climate stress. Synthesis
Smoking: the strongest regulatory precedent, and a weak analogy
US adult cigarette smoking fell from 42.4 per cent in 1965 to about 11 per cent in the 2020s (CDC National Health Interview Survey)[218]. Youth smoking fell further and faster. Guillermo Paraje, Prabhat Jha and colleagues (Nature Medicine, 2024)[211] found that ratification of the WHO Framework Convention on Tobacco Control was associated with fewer smokers under 25 and more quitting among people aged 45 to 59, across 170 countries, with the largest effects where taxes rose most. Strong evidence
Three features made it work: a single identifiable product, a price lever that governments controlled, and an eventual adversarial relationship between regulators and the industry. None of these transfers cleanly to attention or AI markets. Platforms are free at the point of use, so there is no price to tax. The harms are diffuse and contested rather than a single disease with a clear dose-response curve. And the industry remains embedded in the advisory processes that shape its own regulation. The substitution problem is also instructive: CDC data show that between 2017 and 2023 a fall in cigarette smoking was offset by a rise in e-cigarette use, leaving total tobacco product use roughly unchanged. Regulating a product is not the same as removing a demand. Confirmed gap The analogy is untested, and the report does not lean on it.
Post-war reconstruction: conditions, not will
Tony Judt (Postwar, 2005)[207], Barry Eichengreen (The European Economy Since 1945, 2007)[199], and John Dower (Embracing Defeat, 1999)[198] document the reconstruction of Western Europe and Japan. West German output grew rapidly through the 1950s; Japan received a new constitution, land reform, and labour rights under occupation. Strong evidence
Bradford DeLong and Eichengreen (NBER working paper 3899, 1991)[195] argue that the Marshall Plan’s direct financial contribution was too small to explain the recovery, and that its conditions (on wage restraint, market opening, and currency reform) created the institutional settlement that did. Later work by Tamás Vonyó (The Economic Consequences of the War, 2018)[221] argues that conventional accounts overstate both the Plan and the 1948 German reforms and understate surviving industrial capacity and skilled labour. Contested
Eichengreen’s account, together with the Cold War security settlement, points to the enabling conditions: an external security guarantee, surviving institutional and human capital, a negotiated settlement between labour and capital, open export markets, and substantial catch-up potential from a low base. The first is contested by current US retrenchment. The second is what Tracks 4 and 5 document as eroding. The third no longer exists in either economy. The fourth is contested by deglobalisation. The fifth does not apply to economies at the productivity frontier. Reconstruction worked because of conditions, and those conditions are largely absent. Synthesis
Environmental regulation: the clean case, and why it is clean
The US Clean Air Act and its amendments cut combined emissions of six major pollutants by around 78 per cent between 1970 and 2022 while the economy grew several times over (EPA)[219]. The 1990 acid rain trading programme, with later power-sector rules, cut power-station sulphur dioxide emissions by more than 95 per cent, and Lauraine Chestnut and David Mills (2005)[194] estimated its benefits at more than thirty times its cost. The Montreal Protocol phased out about 99 per cent of ozone-depleting substances; the ozone layer is now on a measured recovery path, with full recovery projected around 2066 over Antarctica (WMO Scientific Assessment of Ozone Depletion, 2022)[224]. Strong evidence
The conditions behind these successes are specific. The polluting industries were concentrated in a handful of producers. Substitutes, as Edward Parson (Protecting the Ozone Layer, 2003)[212] shows, were developed at modest cost once controls took effect. The harm was visible, measurable, and scientifically agreed. And no consumer wanted the pollutant itself: people wanted refrigeration, not CFCs. Where harms are diffuse, substitutes are absent, or consumers actively want the product, the model does not transfer. Confirmed gap
This is the one counter-force in the track that appears fully intact and operative today, within its domain.
Democratic transitions: possible, with an anchor
Juan Linz and Alfred Stepan (Problems of Democratic Transition and Consolidation, 1996)[210] and Samuel Huntington (The Third Wave, 1991)[205] document transitions from authoritarian rule in Southern Europe, Latin America, and East Asia. Spain moved from dictatorship to a constitution in three years and to European accession within a decade. South Korea’s 1987 protests produced direct presidential elections and, a decade later, the first opposition victory. Strong evidence South Africa’s transition produced a durable constitution alongside persistent inequality and unemployment. Contested Russia after 1991 is the standard negative case.
Linz and Stepan’s conditions for consolidation include a settled sense of national identity, autonomous civil society, agreed political rules, universal rule of law, and agreed economic governance. A sixth condition appears repeatedly in the cases: an external anchor, most often European accession, that made the settlement credible. Weak Western ties and leverage, including ties to the European Union, are cited in accounts of democratic failure across the former Soviet Union (Lucan Way and Steven Levitsky, East European Politics and Societies, 2007)[222]. Moderate evidence Several of those conditions, particularly civil society capacity and agreement on the rules, are what Tracks 1 and 5 record as under strain, and the external anchor depends on a European Union under its own pressures.
Mutual aid: robust at local scale, untested at systemic scale
Daniel Aldrich (Building Resilience, 2012; Black Wave, 2019)[192] found that Japanese municipalities with stronger social capital had lower mortality and faster recovery after the 2011 earthquake and tsunami, and argued that seawalls did far less to save lives than social ties. Eric Klinenberg (Heat Wave, 2002)[209] found that neighbourhood social conditions, not temperature, explained much of the variation in deaths during the 1995 Chicago heat wave, a finding Christopher Browning and colleagues (American Sociological Review, 2006)[193] partly confirmed: commercial decline predicted deaths, but collective efficacy did not protect elderly residents. Wickes and colleagues (2015)[174] found higher social capital associated with fewer community problems after the Brisbane floods, though the association was no stronger in flooded areas than elsewhere. Moderate evidence
Two limits apply. The findings concern acute, geographically bounded shocks. No literature establishes that mutual aid scales to chronic, distributed, multi-year pressure. Confirmed gap And social capital is not uniformly benign: Aldrich documents strong in-group ties producing exclusion and vigilantism, with racial exclusion after Hurricane Katrina as the clearest case. Contested
The prerequisite is the variable. Mutual aid runs on the social capital that Track 5 documents contracting.
Attention-economy regulation: early and compromised
The European Union’s Digital Services Act took full effect in 2024. In December 2025 the European Commission issued its first non-compliance fine under it[202], €120 million against X, for deceptive verification design, an inadequate advertising repository, and restricted researcher access; X has appealed. Under the Digital Markets Act the Commission fined Apple €500 million and Meta €200 million in April 2025. The UK Online Safety Act moved into enforcement from March 2025[217], with fines so far in the tens of thousands to low millions of pounds. Australia’s under-16 social media ban took effect in December 2025, with platforms restricting about 4.7 million accounts in the first half of December[201] and immediate reports of circumvention through VPNs[208]. As documented developments
The empirical record on whether any of this changes behaviour is thin and partly adverse. Garrett Johnson, Scott Shriver, and Samuel Goldberg (Management Science, 2023)[206] found that the GDPR reduced the number of tracking vendors websites used but increased market concentration, with the largest vendors gaining share. No peer-reviewed study yet documents a measurable reduction in time on platform attributable to the DSA, the Online Safety Act, or the Australian ban. Confirmed gap
The thinness is the finding, not a limitation of this review. Measured against the tobacco timeline, attention-economy regulation is at roughly the stage tobacco control had reached in the early 1970s: the evidence is public, the first penalties have landed, and the mechanism that actually moved behaviour has not yet been found.
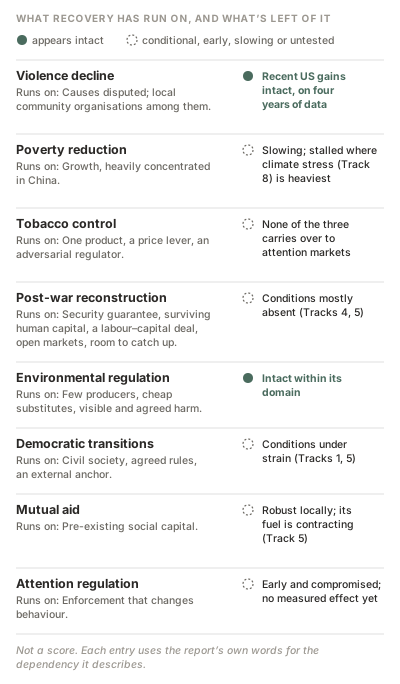
Geographic Scope
The Montreal Protocol, tobacco convention, and poverty findings are global. The Clean Air Act, crime, and firearm suicide data are US-specific. Transition cases are Southern European, East Asian, and South African. Mutual aid studies are Japanese, American, and Australian. Platform regulation is European, British, and Australian. The distribution is asymmetric in a way that matters: where the pressures in Tracks 1 to 8 are strongest, the counter-force evidence is thinnest.
What Is Not Known
- Whether the tobacco model transfers to attention markets. No empirical test exists. Confirmed gap
- Whether platform regulation changes user behaviour. No published measurement. Confirmed gap
- Whether mutual aid scales from acute local shocks to chronic distributed pressure. Confirmed gap
- Whether the post-2022 improvement in US crime is structural or cyclical. A decade of further data would be needed. Confirmed gap
- Whether any population or geography escapes the pattern entirely. None was found. The convergence is unevenly distributed, not absent. Confirmed gap
- How to weight arrest mechanisms whose enabling conditions another track documents as eroding. No framework exists for this, and the report proceeds by stating the dependency case by case rather than scoring it. Confirmed gap
Connection to Adjacent Tracks
Track 9 produces a conditional finding, not a verdict. Counter-forces are real, and two appear intact: the regulatory model for concentrated-source environmental harms, and the recent improvement in US violent crime. The rest depend on conditions that Tracks 1, 4, 5, and 8 record as weakening, are early and compromised, or are decelerating. The report’s convergence claim survives this test in a specific and limited form: not that recovery is impossible, but that the mechanisms through which recovery has historically happened are themselves part of what is under pressure.
| Claim | Rating |
|---|---|
| Long-run decline in interpersonal violence | Strong evidence |
| Medieval baseline for that decline | Contested |
| Causes of the 1990s US crime decline | Contested |
| Global extreme poverty reduction since 1990 | Strong evidence |
| Durability of that trend post-2020 | Contested |
| Tobacco control as regulatory success | Strong evidence |
| Tobacco model transfers to attention markets | Confirmed gap |
| Post-war reconstruction as evidence of recovery | Strong evidence |
| Its enabling conditions present today | Mostly absent |
| Clean Air Act and Montreal Protocol effects | Strong evidence |
| Those models generalise to diffuse harms | Confirmed gap |
| Democratic transitions possible | Strong evidence |
| External anchor as a recurring condition | Moderate evidence |
| Mutual aid at local shock scale | Moderate evidence |
| Mutual aid at systemic scale | Confirmed gap |
| Platform regulation changing behaviour | Confirmed gap |
Convergence Risk Assessment
Part VII
This section reasons forward from the nine tracks. It does not summarise them. Its purpose is to state, in advance and in terms that can be checked, where the convergence is most likely to lead and on what timeframe.
It is a structured synthesis of evidence, not a statistical model. What that means, and what it would take to build the model version, is set out in the calibration note at the end.
Methodology
Probability language
No probability percentages appear in this section. Percentages imply a model that does not exist here. The report uses calibrated terms with the meanings defined below, adapted from the likelihood terms used by the Intergovernmental Panel on Climate Change, which attaches a probability range to each term; those ranges are not used here. These are assessments of evidential weight, not statistical outputs.
| Term | Meaning |
|---|---|
| Almost certain | Overwhelming evidence weight; the alternative would require multiple established findings to be wrong |
| Very likely | Strong evidence; counter-scenarios require conditions the evidence indicates are improbable |
| Likely | Evidence weight favours this outcome |
| About as likely as not | Genuinely contested; the evidence supports both readings |
| Unlikely | Evidence weight favours alternatives |
| Very unlikely | Strong evidence against |
Track inputs
Each track is assessed on direction, rate of change, reversibility, and interaction with the others. Track 9 enters on equal footing with the tracks documenting pressure.
| Track | Direction | Rate | Reversibility | Scope |
|---|---|---|---|---|
| 1. Empire and financial cycles | Worsening | Slow, decades | Low within the cycle | Global, US-focused |
| 2. Psychological infrastructure | Stable and mature | Static | Not applicable; it is a capability, not a trend | Global |
| 3. Delivery technology | Worsening | Fast, years | Moderate; ranking is a design choice | Global |
| 4. Physiological cost | Worsening | Slow, years to decades | Partial for adults; unknown for adolescents | Western, best measured in the US |
| 5. Social fabric | Worsening | Slow, decades | Moderate, but requires institutions that are themselves declining | US; comparable non-US data scarce |
| 6. AI | Direction undetermined | Very fast, months | Unknown | Global |
| 7. Shock events | Worsening, in the sense of shorter recovery | Episodic | Low | US and Western |
| 8. Climate | Worsening | Accelerating, decades | Low within the assessment window | Global, unevenly distributed |
| 9. Counter-forces | Mixed, mostly conditional | Variable | Not applicable | Asymmetric, thinnest where pressure is strongest |
Track 2 is the outlier in this table and deserves a note. It is not deteriorating. It is a set of capabilities that was built, matured, and has not gone away. Its position in the assessment is as a constant that multiplies the others, which is why the report treats it as operating on the instrument of perception rather than alongside the other pressures.
Historical convergence clusters
Before constructing scenarios, the report identifies periods where several tracks were in simultaneous stress. These are where the convergence argument is strongest empirically, and they supply the analogues used below.
| Period | Tracks in stress | Cross-track connections | Rating |
|---|---|---|---|
| AD 235–284, Rome | 1, 5, 8 | Currency debasement, institutional failure, climate variability, and plague in combination; social fragmentation and scapegoating followed | Events Causal weave |
| 1914–1923, Europe | 1, 5, 7 | Imperial transition, mass casualties, hyperinflation in Germany, collapse of trust in official accounts | Strong evidence |
| 1929–1933 | 1, 4, 5, 7 | Debt peak, wealth concentration at 1920s highs, mass unemployment, suicide peak, marriage and birth rates falling | Strong evidence |
| 1939–1945 | All available | Total mobilisation, suspension of civil liberties, followed by the strongest institutional rebuild on record | Events Reading |
| 1964–1974 | 1, 2, 3, 5 | Television-era political communication matures as trust begins its long fall from its 1964 peak | Both Connection |
| 1971 | 1 | End of dollar convertibility; the financial-cycle inflection Dalio’s framework anchors to | Strong evidence |
| 2001–2003 | 1, 3, 7 | Shock window produces durable surveillance infrastructure; brief trust spike then decline | Strong evidence |
| 2008–2012 | 1, 3, 4, 5, 7 | Financial crisis, trust falling below 30 per cent and staying there, ranked feeds spreading, smartphone ownership reaching nearly half of US adults, adolescent mental health beginning to deteriorate | Coincidence Causal links between strands |
| 2020–2022 | All nine | Pandemic compresses digital dependency, prunes social networks, produces a brief trust rally smaller than 2001’s, and coincides with the first large-scale deployment of generative AI | Events Reading |
| 2024–2026 | All nine | Most headline measures in Tracks 1, 5 and 7 at or near their worst recorded levels; Track 4 mixed, with mortality and adolescent measures improving since 2023; Tracks 6 and 8 accelerate | Measurements |
The 2008 to 2012 cluster carries the most analytical weight and the most uncertainty. Financial crisis, trust collapse, ranking algorithms, smartphones, and adolescent mental health all move in the same few years. That the strands are connected is the report’s central synthesis claim. That they are merely simultaneous is the strongest alternative reading, and the evidence does not close it. Contested
Scenarios
Four scenarios are built from the track evidence rather than fitted to a framework. They are distinguishable and between them cover the plausible outcome space for the period to roughly 2035.
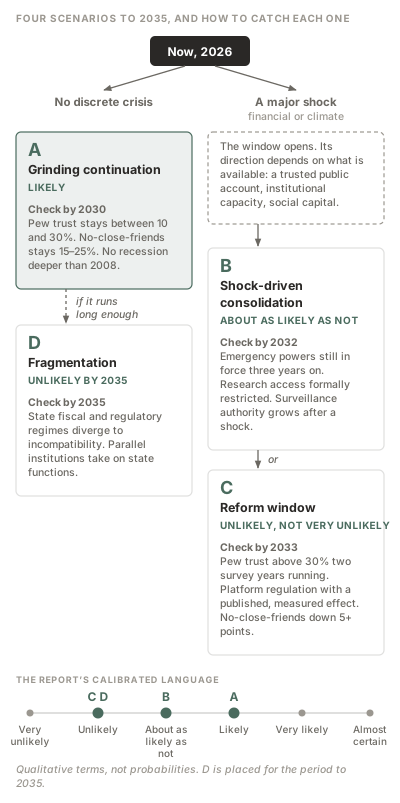
Scenario A: Grinding continuation
No discrete crisis. Each measure continues its current direction at roughly its current rate. Trust settles at levels that make large collective action difficult without making governance impossible. Social networks continue thinning. AI deployment continues without resolution of its effects. Climate damage accumulates as a rising cost rather than a rupture.
Assessment: likely. It requires nothing new. Every track’s current rate of change, extended without acceleration, produces it.
What would confirm it by 2030: Pew trust readings staying within a few points of 17 per cent without either recovery above 30 per cent or collapse below 10 per cent. The Survey Center on American Life’s no-close-friends measure staying between 15 and 25 per cent. No US recession deeper than 2008.
What would disconfirm it: any of the above breached in either direction.
Historical precedent for: Britain from 1945 to 1979, a long managed decline in relative power without institutional rupture.
Precedent against: the interwar period, where measures that appeared to be grinding continuation in 1928 proved to be the approach to a discontinuity. Grinding continuation is what the approach to a rupture looks like from inside it.
Scenario B: Shock-driven consolidation
A shock, most plausibly climate-generated or financial, opens a window that is used to concentrate authority. Emergency measures persist. Surveillance and information control expand. The pattern follows the post-2001 template, but arriving into lower trust, thinner social capital, and a more capable technical infrastructure than 2001 possessed.
Assessment: about as likely as not. Track 7 establishes that windows open and are used. Track 8 establishes that shocks are coming. What the evidence does not establish is direction: the same conditions produced the New Deal.
What would confirm it by 2032: emergency powers adopted during a crisis and still in force more than three years later; formal restrictions on independent research access to platform or government data; expansion rather than contraction of surveillance authority following a shock.
What would disconfirm it: a major shock in this period followed by expiry of emergency measures within two years and no net expansion of surveillance authority.
Historical precedent for: the United States after 2001.
Precedent against: the United States after 1929, where a comparable shock produced redistribution and institution-building rather than consolidation. In the report’s reading, one differentiating variable in that case was a coherent public account of the crisis offered by a trusted source, which is precisely the resource Tracks 1, 3, and 5 record as scarce.
Scenario C: Reform window
A shock or sustained pressure produces institutional rebuilding: regulation that binds, redistribution that reaches median incomes, or a deliberate reconstruction of the information environment. Trust begins to recover from a low base.
Assessment: unlikely, but not very unlikely. Track 9 shows this has happened repeatedly, and that when it did, identifiable conditions held: surviving institutional capacity, an external anchor or security guarantee, a negotiated settlement between interests, and (in the 1930s case in Track 1) a coherent public account. Most of those conditions are weaker now than in the cases where reform succeeded. The environmental regulation model remains intact within its domain, which is the clearest live evidence that binding reform is still possible where harms are concentrated and substitutes exist.
What would confirm it by 2033: a Pew trust reading above 30 per cent sustained across two survey years; platform regulation with a measured effect on user outcomes published in peer-reviewed work; a reversal in the no-close-friends measure of more than five points.
What would disconfirm it: the measures above unmoved by 2033.
Historical precedent for: the New Deal; post-war reconstruction; the Clean Air Act.
Precedent against: the response to 2008, where a shock of comparable scale produced no break-up of the sector that caused it and no recovery in trust.
Scenario D: Fragmentation
Governance fractures below the national level. Sub-national units (regions, cities, or organised communities) diverge sharply in capacity, and the effective unit of collective action shrinks. This is neither recovery nor authoritarian consolidation but the dispersal of both.
Assessment: unlikely in the period to 2035; likely as an eventual outcome of Scenario A if it runs long enough. Turchin’s disintegrative phase and Dalio’s later stages both describe something of this shape. The evidence for the shorter horizon is weaker than for A or B.
What would confirm it by 2035: sustained divergence in state-level fiscal and regulatory regimes to the point of incompatibility; measurable growth of parallel institutions performing functions the state previously performed.
What would disconfirm it: continued federal fiscal and regulatory coherence through the period.
Historical precedent for: the late Roman Empire; the Weimar period’s parallel paramilitary structures.
Precedent against: the United States in the 1930s, where comparable stress increased rather than decreased federal capacity.
Swing variables
These are the points where the outcome is most sensitive to contingency, and therefore where a deliberate intervention would count for most.
- The design direction of AI in relational and emotional domains. This is the largest genuine unknown in the assessment. Track 6 shows the technology is not bound to one outcome, and Track 3’s feed-ranking evidence shows that ranking choices alone move partisan hostility in either direction. It is also the variable moving fastest, on a timescale of months against the years or decades of the other tracks.
- Whether independent longitudinal research on AI and social outcomes gets built. The evidence gap in Track 6 is not incidental. The institutions with the data have the least incentive to publish findings against their interest. Whether that changes determines whether the next decade’s decisions are informed.
- The timing and nature of the next major shock. Track 7 shows the window’s direction is decided by what is available when it opens. Track 8 makes climate the most predictable source.
- Whether the trust floor holds. Pew’s series has fallen but not collapsed. The difference between a low, stable floor and a further fall is the difference between Scenarios A and D.
- Whether social capital stabilises. It is the buffer variable in Track 9’s disaster and mutual aid findings, and the input in Track 5 that is still contracting.
Confidence calibration note
What this framework is: a structured synthesis of evidence from nine tracks, reasoned forward into scenarios with stated falsifiability conditions and calibrated qualitative language.
What it is not: a statistical model. It produces no probability distribution and no confidence intervals. The scenarios are not derived from a formal model of interacting variables; they are constructed from evidence by judgement and stated so they can be checked.
Building the model version would require, at minimum: time series for each track on a common basis, defensible estimates of the cross-track interactions rather than the qualitative couplings used here, a specification of which relationships are causal and which are correlational, and a method for propagating uncertainty through the interactions. None of these currently exists for this combination of domains. The absence is itself a finding, and Track 1 records one part of it: no framework models how a changed information environment alters the speed of the cycle.
The falsifiability conditions above are the point of this section. They are dated and measurable. If the report is wrong, they are where it will be shown to be wrong.
Conclusion: The Pattern and the Catalyst
This report does not identify a single cause. That is not a limitation of the analysis. It is the finding.
Nine bodies of evidence converge on the same historical window. Most of the measures tracked across them have moved in the same direction over the same period. The causal architecture connecting them cannot be established with the rigour each individual track applies to its own claims. The honest position is that the pattern is observable and that its underlying structure is a research problem of considerable complexity, one that no institution has approached with the independence and the longitudinal scope it requires.
Every period of systemic stress produces its dominant explanation. The human disposition to find a discrete cause inside a complex system is itself one of the patterns documented here, and, in the report’s reading of Track 3, one that the current information environment is structurally optimised to reinforce.
Within that complexity, one thread occupies a different position. The trajectory from Freud’s mapping of the unconscious, through Bernays’s commercial application of it, through radio, television, and the ranking systems of the present, does not merely contribute to the pattern alongside the other forces. It operates on the instrument through which people would otherwise perceive and respond to those forces. The other tracks document conditions in the world. This one documents a century of systematic engagement with the pre-rational architecture of human decision-making, refined progressively, scaled enormously, and now operating with a continuity and precision that has no precedent in its own history.
What is historically distinctive about the present is not that systemic stress is occurring. Earlier populations navigated imperial transitions, institutional collapse, and social fragmentation. What those populations retained, in varying measure, were the mechanisms through which people recover from difficulty: sustained attention, social infrastructure, and access to the physical environments in which the relevant biological systems restore themselves. The evidence across these tracks indicates that each of those mechanisms is simultaneously under pressure, and Track 9 adds that the arrest mechanisms which have historically reversed decline depend on the same resources.
The next major shock (and the IPCC projects unavoidable near-term increases in climate hazards) will arrive into a system whose institutional trust and social capital are at documented lows and whose physiological resilience is under documented pressure. Following Milton Friedman’s observation that what happens after a crisis depends on the ideas lying around, the report reads the historical record as showing that the direction taken after systemic stress depends substantially on what analysis is available and whether the quality of independent examination is adequate to the choice being made. Track 7 indicates that trust may be recovering less after each successive shock; that claim is synthesis across datasets rather than a settled finding, and it is rated as such.
None of this is a prediction of inevitable outcomes. The historical cases include the New Deal alongside the shock doctrine, the post-war social contract alongside the surveillance state. Track 3’s strongest single experiment found that changing the ranking of a feed moved political hostility in both directions, which is the clearest available evidence that the systems at the centre of this report are not bound to one outcome. What determines which direction a window opens is, in part, the quality and independence of the thinking available when it does.
The domain most urgently requiring independent longitudinal investigation is the interaction between the algorithmic and conversational infrastructure documented here and the human systems it engages. The evidence base on long-term consequences is structurally inadequate relative to the scale of deployment. That inadequacy is not accidental. In the report’s assessment, the institutions with the most direct access to the relevant data have the least incentive to examine it with the rigour the question demands. Independent investigation, conducted without commercial interest in the findings and with outcomes published regardless of direction, is not a supplementary consideration. It is the condition under which credible knowledge about this problem can be produced at all.
This report is a contribution to that record, and it is written so that it can be shown to be wrong.
The Pattern Beneath the Symptoms. Evidence current to 21 September 2026. All claims evidence-rated. Synthesis claims flagged throughout.
Sources
Listed by track of first substantive use. Works cited in more than one track appear once, at first use.
Track 1: Empire and Financial Cycles
- 1.Auten, G. and Splinter, D. "Income Inequality in the United States: Using Tax Data to Measure Long-Term Trends." Journal of Political Economy (2024)
- 2.Bivens, J. and Mishel, L. Understanding the Historic Divergence Between Productivity and a Typical Worker's Pay: Why It Matters and Why It's Real. Economic Policy Institute Briefing Paper 406 (2015)
- 3.Case, A. and Deaton, A. Deaths of Despair and the Future of Capitalism. Princeton University Press (2020)
- 4.Chetty, R. et al. "The Fading American Dream: Trends in Absolute Income Mobility Since 1940." Science 356 (2017)
- 5.Congressional Budget Office. The Budget and Economic Outlook: 2026 to 2036 (2026)
- 6.Dalio, R. Principles for Dealing with the Changing World Order: Why Nations Succeed and Fail. Avid Reader Press (2021)
- 7.Dalio, R. Interview, Financial Times (May 2024); commentary reported in Fortune (26 January 2026)
- 8.European Central Bank. The international role of the euro (June 2026)
- 9.Eusebius. Ecclesiastical History, trans. McGiffert, A.C. Christian Literature Publishing Co. (1890)
- 10.Fergusson, A. When Money Dies: The Nightmare of the Weimar Hyperinflation. William Kimber (1975)
- 11.Fussell, P. The Great War and Modern Memory. Oxford University Press (1975)
- 12.Gallup. Confidence in Institutions, annual series (2026 release)
- 13.Harper, K. The Fate of Rome: Climate, Disease, and the End of an Empire. Princeton University Press (2017)
- 14.Howe, N. The Fourth Turning Is Here. Simon & Schuster (2023)
- 15.International Monetary Fund. Currency Composition of Official Foreign Exchange Reserves (COFER), Data Brief (July 2026)
- 16.Moody's Ratings. United States sovereign rating action (May 2025)
- 17.Piketty, T. and Saez, E. Income inequality series, and World Inequality Database
- 18.Pew Research Center. Public Trust in Government: 1958–2025 (December 2025)
- 19.Pontius. Life and Passion of Cyprian, trans. Wallis, R.E. In Ante-Nicene Fathers, vol. 5. Christian Literature Publishing Co. (1886)
- 20.Rives, J. "The Decree of Decius and the Religion of Empire." Journal of Roman Studies 89 (1999)
- 21.Strauss, W. and Howe, N. The Fourth Turning. Broadway Books (1997)
- 22.Terkel, S. Hard Times: An Oral History of the Great Depression. Pantheon (1970)
- 23.Turchin, P. Ages of Discord (2016); End Times (2023)
- 24.Turchin, P. "The Prophecy of the Fourth Turning." Cliodynamica, peterturchin.com (6 November 2017)
- 25.Turchin, P. "Political instability may be a contributor in the coming decade." Nature 463 (2010)
- 26.Turchin, P. and Korotayev, A. "The 2010 structural-demographic forecast for the 2010–2020 decade: A retrospective assessment." PLOS ONE 15(8) (2020)
- 27.US Census Bureau. Income in the United States: 2024 (September 2025); Gini index series 1967–2024
- 28.US Centers for Disease Control and Prevention, National Center for Health Statistics. Life expectancy and historical mortality series
- 29.Voteview (UCLA). DW-NOMINATE congressional polarisation series
- 30.Wilkinson, E. The Town That Was Murdered. Victor Gollancz (1939)
- 31.World Gold Council. Gold Demand Trends, annual series
Track 2: The Psychological Infrastructure
- 32.Asch, S. "Effects of group pressure upon the modification and distortion of judgments" (1951)
- 33.Bargh, J. and Morsella, E. "The Unconscious Mind." Perspectives on Psychological Science 3(1) (2008)
- 34.Bernays, E. Crystallizing Public Opinion (1923); Propaganda (1928); "The Engineering of Consent" (1947); Biography of an Idea (1965)
- 35.Blass, T. "A Cross-Cultural Comparison of Studies of Obedience Using the Milgram Paradigm: A Review." Social and Personality Psychology Compass 6 (2012)
- 36.Bond, R. and Smith, P.B. "Culture and Conformity: A Meta-Analysis of Studies Using Asch's (1952b, 1956) Line Judgment Task." Psychological Bulletin 119 (1996)
- 37.Boorstin, D. The Image: A Guide to Pseudo-Events in America. Atheneum (1961)
- 38.Cialdini, R. Influence: The Psychology of Persuasion. Harper (1984)
- 39.Creel, G. How We Advertised America. Harper & Brothers (1920); Committee on Public Information. Complete Report of the Chairman, 1917, 1918, 1919. Government Printing Office (1920)
- 40.Damasio, A. Descartes' Error. Putnam (1994)
- 41.Ewen, S. Captains of Consciousness. McGraw-Hill (1976)
- 42.Festinger, L. "A Theory of Social Comparison Processes." Human Relations 7 (1954)
- 43.Ferster, C. and Skinner, B.F. Schedules of Reinforcement. Appleton-Century-Crofts (1957)
- 44.Frank, T. The Conquest of Cool. University of Chicago Press (1997)
- 45.Franzen, A. and Mader, S. Replication of Asch conformity experiments. PLOS ONE (2023)
- 46.Freud, S. Group Psychology and the Analysis of the Ego (1921); Civilisation and Its Discontents (1930)
- 47.Higgins, E.T. "Self-Discrepancy: A Theory Relating Self and Affect." Psychological Review 94 (1987)
- 48.Kahan, D. et al. "The Polarizing Impact of Science Literacy and Numeracy on Perceived Climate Change Risks." Nature Climate Change 2 (2012); Cultural Cognition Project, Yale Law School
- 49.Kahneman, D. Thinking, Fast and Slow. Farrar, Straus and Giroux (2011)
- 50.Krugman, H. "Brain Wave Measures of Media Involvement." Journal of Advertising Research 11 (1971)
- 51.Le Bon, G. The Crowd: A Study of the Popular Mind (1895)
- 52.Libet, B. Readiness-potential experiments (1983)
- 53.Malherek, J. "Freud's American Nephew: Edward Bernays and the Selling of Psychoanalysis." Psychoanalysis and History 25(1) (2023)
- 54.McGinniss, J. The Selling of the President 1968. Trident Press (1969)
- 55.McLuhan, M. Understanding Media. McGraw-Hill (1964)
- 56.Milgram, S. "Behavioral Study of Obedience." Journal of Abnormal and Social Psychology 67 (1963)
- 57.Milgram, S. Obedience to Authority: An Experimental View. Harper & Row (1974)
- 58.Murphree, V. "Edward Bernays's 1929 'Torches of Freedom' March: Myths and Historical Significance." American Journalism 32(3) (2015)
- 59.Nisbett, R. and Wilson, T. "Telling More Than We Can Know." Psychological Review 84 (1977)
- 60.Packard, V. The Hidden Persuaders. David McKay (1957)
- 61.Postman, N. Amusing Ourselves to Death. Viking (1985)
- 62.Schlesinger, S. and Kinzer, S. Bitter Fruit. Doubleday (1982)
- 63.Schudson, M. Advertising, the Uneasy Persuasion. Basic Books (1984)
- 64.Schurger, A. et al. "An accumulator model for spontaneous neural activity prior to self-initiated movement." PNAS 109 (2012)
- 65.Shapiro, L. Something from the Oven. Viking (2004)
- 66.Smithsonian National Museum of American History, Archives Center. Marlboro Oral History and Documentation Project, 1926–1988 (NMAH.AC.0198). Smithsonian Institution
- 67.Soon, C.S. et al. "Unconscious determinants of free decisions in the human brain." Nature Neuroscience 11 (2008)
- 68.Tajfel, H. Minimal group paradigm experiments (1970–1971)
- 69.Tye, L. The Father of Spin: Edward L. Bernays and the Birth of Public Relations. Crown (1998)
Track 3: Technology as Delivery Mechanism
- 70.Brady, W.J., Wills, J.A., Jost, J.T., Tucker, J.A. and Van Bavel, J.J. "Emotion Shapes the Diffusion of Moralized Content in Social Networks." PNAS 114 (2017)
- 71.Chen, A., Nyhan, B., Reifler, J., Robertson, R. and Wilson, C. "Subscriptions and external links help drive resentful users to alternative and extremist YouTube channels." Science Advances 9 (2023)
- 72.Chomanski, B. "Mental Integrity in the Attention Economy." Neuroethics 16 (2023)
- 73.Bail, C. Breaking the Social Media Prism. Princeton University Press (2021)
- 74.González de la Torre, P., Pérez-Verdugo, M. and Barandiaran, X. "Attention is all they need: cognitive science and the (techno)political economy of attention in humans and machines." AI & Society 41(1) (2026) https://doi.org/10.1007/s00146-025-02400-z
- 75.Guess, A. et al. "How do social media feed algorithms affect attitudes and behavior in an election campaign?" and companion papers. Science 381 (2023)
- 76.Haidt, J. and Bail, C. "Social Media and Political Dysfunction: A Collaborative Review." Unpublished collaborative review, Google Docs (version of 28 August 2023)
- 77.Hansen, M. "From attention economy to cognitive lock-ins." Big Data & Society (2024)
- 78.Haugen, F. Disclosures reported in the Wall Street Journal (September 2021) and the Washington Post (26 October 2021)
- 79.Joseph, J. "The algorithmic self." Frontiers in Psychology 16 (2025)
- 80.Marino, S. "Display & Video Ads Benchmarks 2026: Exclusive Data & Insights for Every Industry." WordStream (2026)
- 81.Morozov, E. "Capitalism's New Clothes." The Baffler (2019)
- 82.Müller, K. and Schwarz, C. "Fanning the Flames of Hate: Social Media and Hate Crime." Journal of the European Economic Association 19(4) (2021)
- 83.Parker, S. Interview, Axios (November 2017)
- 84.Pew Research Center. Mobile Fact Sheet, smartphone ownership series
- 85.Facebook Engineering. "Introducing FBLearner Flow: Facebook's AI backbone" (9 May 2016)
- 86.Piccardi, T. et al. "Reranking partisan animosity in algorithmic social media feeds alters affective polarization." Science 390 (2025) https://doi.org/10.1126/science.adu5584
- 87.Rathje, S., Van Bavel, J.J. and van der Linden, S. "Out-Group Animosity Drives Engagement on Social Media." PNAS 118 (2021)
- 88.Wang, T. "Media, Pulpit, and Populist Persuasion: Evidence from Father Coughlin." American Economic Review 111(9) (2021)
- 89.Wu, T. The Attention Merchants. Knopf (2016)
- 90.Zuboff, S. The Age of Surveillance Capitalism. PublicAffairs (2019)
Track 4: Physiological Consequences
- 91.Carter, B. et al. "Association Between Portable Screen-Based Media Device Access or Use and Sleep Outcomes." JAMA Pediatrics 170(12) (2016)
- 92.Case, A. and Deaton, A. "Mortality and Morbidity in the 21st Century." Brookings Papers on Economic Activity (2017)
- 93.Cudjoe, T. et al. "Getting under the skin: Social isolation and biological markers in the National Health and Aging Trends Study." Journal of the American Geriatrics Society 70(2) (2022) https://doi.org/10.1111/jgs.17518
- 94.Granieri, A. et al. "Loneliness, the immune system, and cardiovascular health: A systematic literature review." British Journal of Health Psychology 31(1) (2026) https://doi.org/10.1111/bjhp.70044
- 95.Haidt, J. The Anxious Generation. Penguin Press (2024)
- 96.Hinz, E. et al. "Childhood allostatic load predicts cardiometabolic health in adulthood." PNAS 122(39) (2025)
- 97.Holt-Lunstad, J. et al. "Loneliness and Social Isolation as Risk Factors for Mortality." Perspectives on Psychological Science 10(2) (2015)
- 98.Irwin, M.R., Olmstead, R. and Carroll, J.E. "Sleep Disturbance, Sleep Duration, and Inflammation: A Systematic Review and Meta-Analysis of Cohort Studies and Experimental Sleep Deprivation." Biological Psychiatry 80 (2016)
- 99.Kanbay, M. et al. "Social isolation and loneliness: Undervalued risk factors for disease states and mortality." European Journal of Clinical Investigation 53 (2023)
- 100.Krause, A., Walker, M. et al. "The sleep-deprived human brain." Nature Reviews Neuroscience 18 (2017)
- 101.Lebel, C. and Beaulieu, C. "Longitudinal Development of Human Brain Wiring Continues from Childhood into Adulthood." Journal of Neuroscience 31 (2011)
- 102.Lenhart, A. Teens, Social Media & Technology Overview 2015. Pew Research Center (2015)
- 103.Leproult, R., Copinschi, G., Buxton, O. and Van Cauter, E. "Sleep Loss Results in an Elevation of Cortisol Levels the Next Evening." Sleep 20 (1997)
- 104.Liston, C., McEwen, B.S. and Casey, B.J. "Psychosocial Stress Reversibly Disrupts Prefrontal Processing and Attentional Control." PNAS 106 (2009)
- 105.Lucente, M. and Guidi, J. "Allostatic Load in Children and Adolescents: A Systematic Review." Psychotherapy and Psychosomatics 92(5) (2023)
- 106.Marcotte, D. and Hansen, B. "The Re-emerging Suicide Crisis in the U.S.: Patterns, Causes and Solutions." Journal of Policy Analysis and Management 43(2) (2024) https://doi.org/10.1002/pam.22526
- 107.Mark, G. Attention Span. Hanover Square Press (2023)
- 108.McEwen, B. and Stellar, E. "Stress and the Individual." Archives of Internal Medicine 153 (1993)
- 109.Miller, G.E., Chen, E. and Zhou, E.S. "If It Goes Up, Must It Come Down? Chronic Stress and the Hypothalamic-Pituitary-Adrenocortical Axis in Humans." Psychological Bulletin 133 (2007)
- 110.Odgers, C. "The great rewiring: is social media really behind an epidemic of teenage mental illness?" Nature 628 (2024)
- 111.Radley, J.J. et al. "Chronic Behavioral Stress Induces Apical Dendritic Reorganization in Pyramidal Neurons of the Medial Prefrontal Cortex." Neuroscience 125 (2004)
- 112.Ringwald, K. et al. "Association between stressful life events and grey matter volume in the medial prefrontal cortex." Human Brain Mapping 43 (2022)
- 113.Seeman, T. et al. "Cumulative biological risk and socio-economic differences in mortality: MacArthur Studies of Successful Aging." Social Science & Medicine 58(10) (2004)
- 114.US Centers for Disease Control and Prevention. Youth Risk Behavior Survey, 2011–2021
- 115.US Joint Economic Committee. Long-Term Trends in Deaths of Despair (2019)
- 116.US Surgeon General. Our Epidemic of Loneliness and Isolation (2023)
- 117.Valtorta, N. et al. "Loneliness and social isolation as risk factors for coronary heart disease and stroke." Heart 102 (2016)
- 118.Vyas, A., Mitra, R., Shankaranarayana Rao, B.S. and Chattarji, S. "Chronic Stress Induces Contrasting Patterns of Dendritic Remodeling in Hippocampal and Amygdaloid Neurons." Journal of Neuroscience 22 (2002)
- 119.Wood, B. et al. "Light level and duration of exposure determine the impact of self-luminous tablets on melatonin suppression." Applied Ergonomics 44 (2013)
Track 5: Relationship and Social Fabric
- 120.AmeriCorps and US Census Bureau. Civic Engagement and Volunteering survey
- 121.Cox, D. The State of American Friendship: Change, Challenges, and Loss. Survey Center on American Life (2021)
- 122.Cox, D. "Men's Social Circles are Shrinking." Survey Center on American Life (29 June 2021)
- 123.Cox, D. "America's 'Friendship Recession' Is Weakening Civic Life." Survey Center on American Life newsletter (24 August 2023)
- 124.Cox, D. and Pressler, S. Disconnected: The Growing Class Divide in American Civic Life. Survey Center on American Life (2024)
- 125.Dunbar, R. "Coevolution of neocortical size, group size and language in humans." Behavioral and Brain Sciences 16 (1993)
- 126.Dunbar, R. "The Anatomy of Friendship." Trends in Cognitive Sciences 22(1) (2018) https://doi.org/10.1016/j.tics.2017.10.004
- 127.Gallup Organization. Gallup News Service Poll: January 1990, Wave 2. Roper Center for Public Opinion Research (1990) https://doi.org/10.25940/ROPER-31088676
- 128.Hickok, G. The Myth of Mirror Neurons: The Real Neuroscience of Communication and Cognition. W.W. Norton (2014)
- 129.Horton, D. and Wohl, R. "Mass Communication and Para-Social Interaction." Psychiatry 19 (1956)
- 130.Lindenfors, P. et al. "'Dunbar's number' deconstructed." Biology Letters 17 (2021)
- 131.Liu, J. and Lee, J.-S. "Social media influencers and followers' loneliness: the mediating roles of parasocial relationship, sense of belonging, and social support." Online Media and Global Communication 3(4) (2024)
- 132.Pew Research Center. Decline of Christianity in the U.S. Has Slowed, May Have Leveled Off: 2023-24 Religious Landscape Study (26 February 2025)
- 133.Putnam, R. Bowling Alone. Simon & Schuster (2000)
- 134.Stein, J.-P., Liebers, N. and Faiss, M. "Feeling Better... But Also Less Lonely? An Experimental Comparison of How Parasocial and Social Relationships Affect People's Well-Being." Mass Communication and Society 27(3) (2024) https://doi.org/10.1080/15205436.2022.2127369
Track 6: Technology, AI, and the Question of What Comes Next
- 135.Associated Press. "Meta appeals landmark jury verdict that found it to blame for social media addiction for young users" (10 July 2026)
- 136.Babu, J. et al. "Emotional AI and the rise of pseudo-intimacy: are we trading authenticity for algorithmic affection?" Frontiers in Psychology 16 (2025) https://doi.org/10.3389/fpsyg.2025.1679324
- 137.Bjork, R. "Memory and metamemory considerations in the training of human beings." MIT Press (1994)
- 138.Budzyń, K. et al. "Endoscopist deskilling risk after exposure to artificial intelligence in colonoscopy: a multicentre, observational study." Lancet Gastroenterology & Hepatology 10(10) (2025) https://doi.org/10.1016/S2468-1253(25)00133-5
- 139.Chatterji, A. et al. "How People Use ChatGPT." NBER Working Paper 34255 (2025) https://doi.org/10.3386/w34255
- 140.Folk, D. and Dunn, E. "How Does Turning to AI for Companionship Predict Loneliness and Vice Versa?" Psychological Science 37(4) (2026) https://doi.org/10.1177/09567976261427747
- 141.Galindez-Acosta, J.S. and Giraldo-Huertas, J.J. "Trust in AI emerges from distrust in humans: A machine learning study on decision-making guidance." arXiv 2511.16769 (2025)
- 142.Garcia v. Character Technologies, Inc., US District Court, Middle District of Florida (May 2025 order; settled January 2026)
- 143.De Freitas, J. et al. "AI Companions Reduce Loneliness." Harvard Business School working paper 24-078 (2024)
- 144.Fang, C.M. et al. "How AI and Human Behaviors Shape Psychosocial Effects of Chatbot Use." arXiv 2503.17473 (2025)
- 145.Habicht, J. et al. "Generative AI–Enabled Therapy Support Tool for Improved Clinical Outcomes and Patient Engagement in Group Therapy: Real-World Observational Study." Journal of Medical Internet Research 27 (2025) https://doi.org/10.2196/60435
- 146.International AI Safety Report 2026, chaired by Y. Bengio
- 147.K.G.M. v. Meta Platforms, Inc., Los Angeles Superior Court (2026)
- 148.Kirk, H.R. et al. "Neural steering vectors reveal dose and exposure-dependent impacts of human-AI relationships." arXiv 2512.01991 (2025)
- 149.Kleinert, T. et al. "AI outperforms humans in establishing interpersonal closeness in emotionally engaging interactions, but only when labelled as human." Communications Psychology 4 (2026) https://doi.org/10.1038/s44271-025-00391-7
- 150.Maltezou-Papastylianou, C., Scherer, R. and Paulmann, S. "How do voice acoustics affect the perceived trustworthiness of a speaker? A systematic review." Frontiers in Psychology 16 (2025) https://doi.org/10.3389/fpsyg.2025.1495456
- 151.Marchegiani, B. "Anthropomorphism, False Beliefs, and Conversational AIs: How Chatbots Undermine Users' Autonomy." Journal of Applied Philosophy 42(5) (2025)
- 152.Miller, W. and Rollnick, S. Motivational Interviewing, 3rd edition. Guilford Press (2013)
- 153.Montag, C. et al. "Trust toward humans and trust toward artificial intelligence are not associated: Initial insights from self-report and neurostructural brain imaging." Personality Neuroscience 6 (2023) https://doi.org/10.1017/pen.2022.5
- 154.Montag, C., Becker, B. and Li, B.J. "On trust in humans and trust in artificial intelligence: A study with samples from Singapore and Germany extending recent research." Computers in Human Behavior: Artificial Humans 2(2) (2024) https://doi.org/10.1016/j.chbah.2024.100070
- 155.Muldoon, J. and Parke, J.J. "Cruel companionship." New Media & Society (2025)
- 156.Sadeh-Sharvit, S. et al. "Effects of an Artificial Intelligence Platform for Behavioral Interventions on Depression and Anxiety Symptoms: Randomized Clinical Trial." Journal of Medical Internet Research 25 (2023) https://doi.org/10.2196/46781
- 157.Sharma, M., McCain, M., Douglas, R. and Duvenaud, D. "Who's in Charge? Disempowerment Patterns in Real-World LLM Usage." arXiv 2601.19062 (2026)
- 158.State of California. SB 243 (2025)
- 159.European Union. Product Liability Directive 2024/2853
- 160.State of New York. General Business Law Article 47, safeguards for AI companions (in effect 5 November 2025)
- 161.Yuan, Y. et al. "Mental Health Impacts of AI Companions: Triangulating Social Media Quasi-Experiments, User Perspectives, and Relational Lens." CHI '26 (2026); arXiv 2509.22505
Track 7: Shock Events
- 162.Bordo, M. and Haubrich, J. "Deep Recessions, Fast Recoveries, and Financial Crises." Economic Inquiry 55(1) (2017)
- 163.Dynes, R. and Quarantelli, E.L. "Community Conflict: Its Absence and Its Presence in Natural Disasters." Disaster Research Center Working Paper 34 (1971)
- 164.Estadieu, L. et al. "Institutional Trust in Crisis?" Sociology Compass 19(6) (2025)
- 165.Friedman, M. Preface to the 1982 edition of Capitalism and Freedom. University of Chicago Press
- 166.Klein, N. The Shock Doctrine. Metropolitan Books (2007)
- 167.Lalot, F. et al. "The social cohesion investment." Journal of Community & Applied Social Psychology 32 (2021)
- 168.McGee, R. "The governance shock doctrine." Development Policy Review 41 (2023)
- 169.Norberg, J. "The Klein Doctrine: The Rise of Disaster Polemics." Cato Institute Briefing Paper 102 (2008)
- 170.Patulny, R. and Bower, M. "Beware the 'loneliness gap'?" Australian Journal of Social Issues 57 (2022)
- 171.Silveira, S. et al. "Tend-and-befriend and rally around the flag effects during the COVID-19 pandemic." European Journal of Social Psychology 53 (2023)
- 172.Stiglitz, J. "Bleakonomics." New York Times Book Review (2007)
- 173.van der Meer, T. and van Erkel, P. "Moving beyond the political trust crisis debate." European Journal of Political Research (2023)
- 174.Wickes, R. et al. "Neighborhood Structure, Social Capital, and Community Resilience." Social Science Quarterly 96 (2015)
Track 8: Climate and Environmental Stress
- 175.Balsari, S., Dresser, C. and Leaning, J. "Climate Change, Migration, and Civil Strife." Current Environmental Health Reports 7 (2020)
- 176.Berman, M., Jonides, J. and Kaplan, S. "The Cognitive Benefits of Interacting With Nature." Psychological Science 19 (2008)
- 177.Bratman, G. et al. "Nature experience reduces rumination and subgenual prefrontal cortex activation." PNAS 112 (2015)
- 178.Buhaug, H. "Climate not to blame for African civil wars." PNAS 107 (2010)
- 179.Burke, M., Hsiang, S. and Miguel, E. "Climate and Conflict." Annual Review of Economics 7 (2015)
- 180.Clement, V. et al. Groundswell Part 2: Acting on Internal Climate Migration. World Bank (2021)
- 181.Hsiang, S., Burke, M. and Miguel, E. "Quantifying the Influence of Climate on Human Conflict." Science 341 (2013)
- 182.Internal Displacement Monitoring Centre. Global Report on Internal Displacement (2021)
- 183.IPCC. Sixth Assessment Report, Working Group II (2022)
- 184.Kaplan, R. and Kaplan, S. The Experience of Nature. Cambridge University Press (1989)
- 185.Kim, K. et al. "Global prevalence of seasonal affective disorder by latitude: A systematic review and meta-analysis." Journal of Affective Disorders 390 (2025) https://doi.org/10.1016/j.jad.2025.119807
- 186.Mersch, P. et al. "Seasonal affective disorder and latitude: a review of the literature." Journal of Affective Disorders 53 (1999) https://doi.org/10.1016/S0165-0327(98)00097-4
- 187.Meyer, C. et al. "Seasonality in human cognitive brain responses." PNAS 113 (2016)
- 188.Ohly, H. et al. "Attention Restoration Theory: A Systematic Review of the Attention Restoration Potential of Exposure to Natural Environments." Journal of Toxicology and Environmental Health, Part B 19 (2016)
- 189.Rosenthal, N. et al. "Seasonal affective disorder: a description of the syndrome and preliminary findings with light therapy." Archives of General Psychiatry 41 (1984)
- 190.Ulrich, R. "View through a window may influence recovery from surgery." Science 224 (1984)
- 191.United Nations. World Urbanization Prospects: The 2018 Revision
Track 9: Resilience and Counter-Forces
- 192.Aldrich, D. Building Resilience (2012); Black Wave (2019). University of Chicago Press
- 193.Browning, C. et al. "Neighborhood Social Processes, Physical Conditions, and Disaster-Related Mortality." American Sociological Review 71 (2006)
- 194.Chestnut, L. and Mills, D. "A fresh look at the benefits and costs of the US acid rain program." Journal of Environmental Management 77(3) (2005)
- 195.DeLong, J.B. and Eichengreen, B. "The Marshall Plan: History's Most Successful Structural Adjustment Program." NBER working paper 3899 (1991)
- 196.Donohue, J. and Levitt, S. "The Impact of Legalized Abortion on Crime." Quarterly Journal of Economics 116 (2001)
- 197.Donohue, J. and Levitt, S. "Measurement Error, Legalized Abortion, and the Decline in Crime: A Response to Foote and Goetz." Quarterly Journal of Economics 123 (2008)
- 198.Dower, J. Embracing Defeat. W.W. Norton (1999)
- 199.Eichengreen, B. The European Economy Since 1945. Princeton University Press (2007)
- 200.Eisner, M. "Long-Term Historical Trends in Violent Crime." Crime and Justice 30 (2003)
- 201.eSafety Commissioner (Australia). "Platforms restrict access to 4.7 million under-16 accounts across Australia" (January 2026)
- 202.European Commission. Digital Services Act non-compliance decision against X (5 December 2025); Digital Markets Act decisions against Apple and Meta (April 2025)
- 203.Foote, C. and Goetz, C. Comment on Donohue and Levitt. Quarterly Journal of Economics 123 (2008)
- 204.Higney, A., Hanley, N. and Moro, M. "The lead-crime hypothesis: A meta-analysis." Regional Science and Urban Economics 97 (2022)
- 205.Huntington, S. The Third Wave. University of Oklahoma Press (1991)
- 206.Johnson, G., Shriver, S. and Goldberg, S. "Privacy and Market Concentration: Intended and Unintended Consequences of the GDPR." Management Science 69 (2023)
- 207.Judt, T. Postwar. Penguin (2005)
- 208.Kaye, B. "Australian leader defends social media ban as teens flaunt workarounds." Reuters (11 December 2025); ABC News, "Social media ban: Families, teens question new access and verification rules", live blog (10 December 2025)
- 209.Klinenberg, E. Heat Wave. University of Chicago Press (2002)
- 210.Linz, J. and Stepan, A. Problems of Democratic Transition and Consolidation. Johns Hopkins University Press (1996)
- 211.Paraje, G. et al. "Reductions in smoking due to ratification of the Framework Convention for Tobacco Control in 171 countries." Nature Medicine 30 (2024) https://doi.org/10.1038/s41591-024-02806-0
- 212.Parson, E. Protecting the Ozone Layer. Oxford University Press (2003)
- 213.Pinker, S. The Better Angels of Our Nature. Viking (2011)
- 214.Reyes, J.W. "Environmental Policy as Social Policy? The Impact of Childhood Lead Exposure on Crime." NBER working paper 13097 (2007)
- 215.Sharkey, P., Torrats-Espinosa, G. and Takyar, D. "Community and the Crime Decline: The Causal Effect of Local Nonprofits on Violent Crime." American Sociological Review 82(6) (2017)
- 216.Sharkey, P. Uneasy Peace. W.W. Norton (2018)
- 217.UK Ofcom. Online Safety Act enforcement programme updates (2025)
- 218.US Centers for Disease Control and Prevention. National Health Interview Survey, smoking prevalence; firearm mortality data
- 219.US Environmental Protection Agency. Progress Cleaning the Air and Improving People's Health (2023)
- 220.US Federal Bureau of Investigation. Uniform Crime Reports, 2024
- 221.Vonyó, T. The Economic Consequences of the War: West Germany's Growth Miracle after 1945. Cambridge University Press (2018)
- 222.Way, L. and Levitsky, S. "Linkage, Leverage, and the Post-Communist Divide." East European Politics and Societies 21 (2007)
- 223.World Bank. Poverty, Prosperity, and Planet Report (2024); Four Decades of Poverty Reduction in China (2022)
- 224.World Meteorological Organization. Scientific Assessment of Ozone Depletion (2022)
- 225.Xu, J. et al. Mortality in the United States, 2024. NCHS Data Brief 548. National Center for Health Statistics (2026) https://doi.org/10.15620/cdc/174641
- 226.Zimring, F. The Great American Crime Decline. Oxford University Press (2007)
Open review
This is a living document. Our thinking is still developing and some of it will turn out to be wrong. If a claim looks off or a source doesn't hold up, tell us below.
Review ledger
Track 4: Physiological Consequences
Added a longitudinal study (Elena Hinz, William Copeland and colleagues, PNAS, 2025) finding that allostatic load measured between ages 9 and 16 predicted poorer cardiometabolic health at age 30.
Why New evidence that stress in childhood carries into adult health.
Track 6: Technology, AI, and the Question of What Comes Next
Added a 12-month, four-wave panel study of 2,149 adults (Dunigan Folk and Elizabeth Dunn, Psychological Science, 2026) linking social-chatbot use to later emotional isolation. Added New York's AI companion law, in effect from November 2025, and Meta's July 2026 appeal of the K.G.M. verdict.
Why The first longer-term evidence on AI companionship, and legal developments in the area.
Track 9: Resilience and Counter-Forces
Added the first figures from Australia's under-16 social media ban (about 4.7 million accounts restricted in its first weeks, with early reports of workarounds), US suicide data for 2024, and a study across 170 countries linking the WHO tobacco convention to fewer young smokers (Guillermo Paraje, Prabhat Jha and colleagues, Nature Medicine, 2024).
Why More recent data on the interventions this track assesses.
Track 4 and abstract
Dated Gloria Mark's 47-second attention studies to 2016–2021, as she reports them, and described them as office workers at their screens.
Why The earlier dates (2014–2020) did not match the source.
Track 1: Empire and Financial Cycles
US life expectancy now reads: fell in 2015, held level in 2016 and fell again in 2017.
Why The National Center for Health Statistics revised its 2016 figure.
Track 8: Climate and Environmental Stress
Corrected the authors of "Climate Change, Migration, and Civil Strife" (2020) to Satchit Balsari, Caleb Dresser and Jennifer Leaning.
Why The paper was credited to the wrong authors.